A powerful, easily deployable network traffic analysis tool suite for network security monitoring
Arkime
Zeek log integration
A stock installation of Arkime extracts all its network connection (“session”) metadata (“SPI” or “Session Profile Information”) from full packet capture artifacts (PCAP files). Zeek generates similar session metadata, linking network events to sessions via a connection UID. Malcolm aims to facilitate analysis of Zeek logs by mapping values from Zeek logs to the Arkime session database schema for equivalent fields, and by creating new “native” Arkime database fields for all other Zeek log values for which there is not currently an equivalent in Arkime:
In this way, when full packet capture is an option, analysis of PCAP files can be enhanced by the additional information Zeek provides. When full packet capture is not an option, similar analysis can still be performed using the same interfaces and processes using the Zeek logs alone.
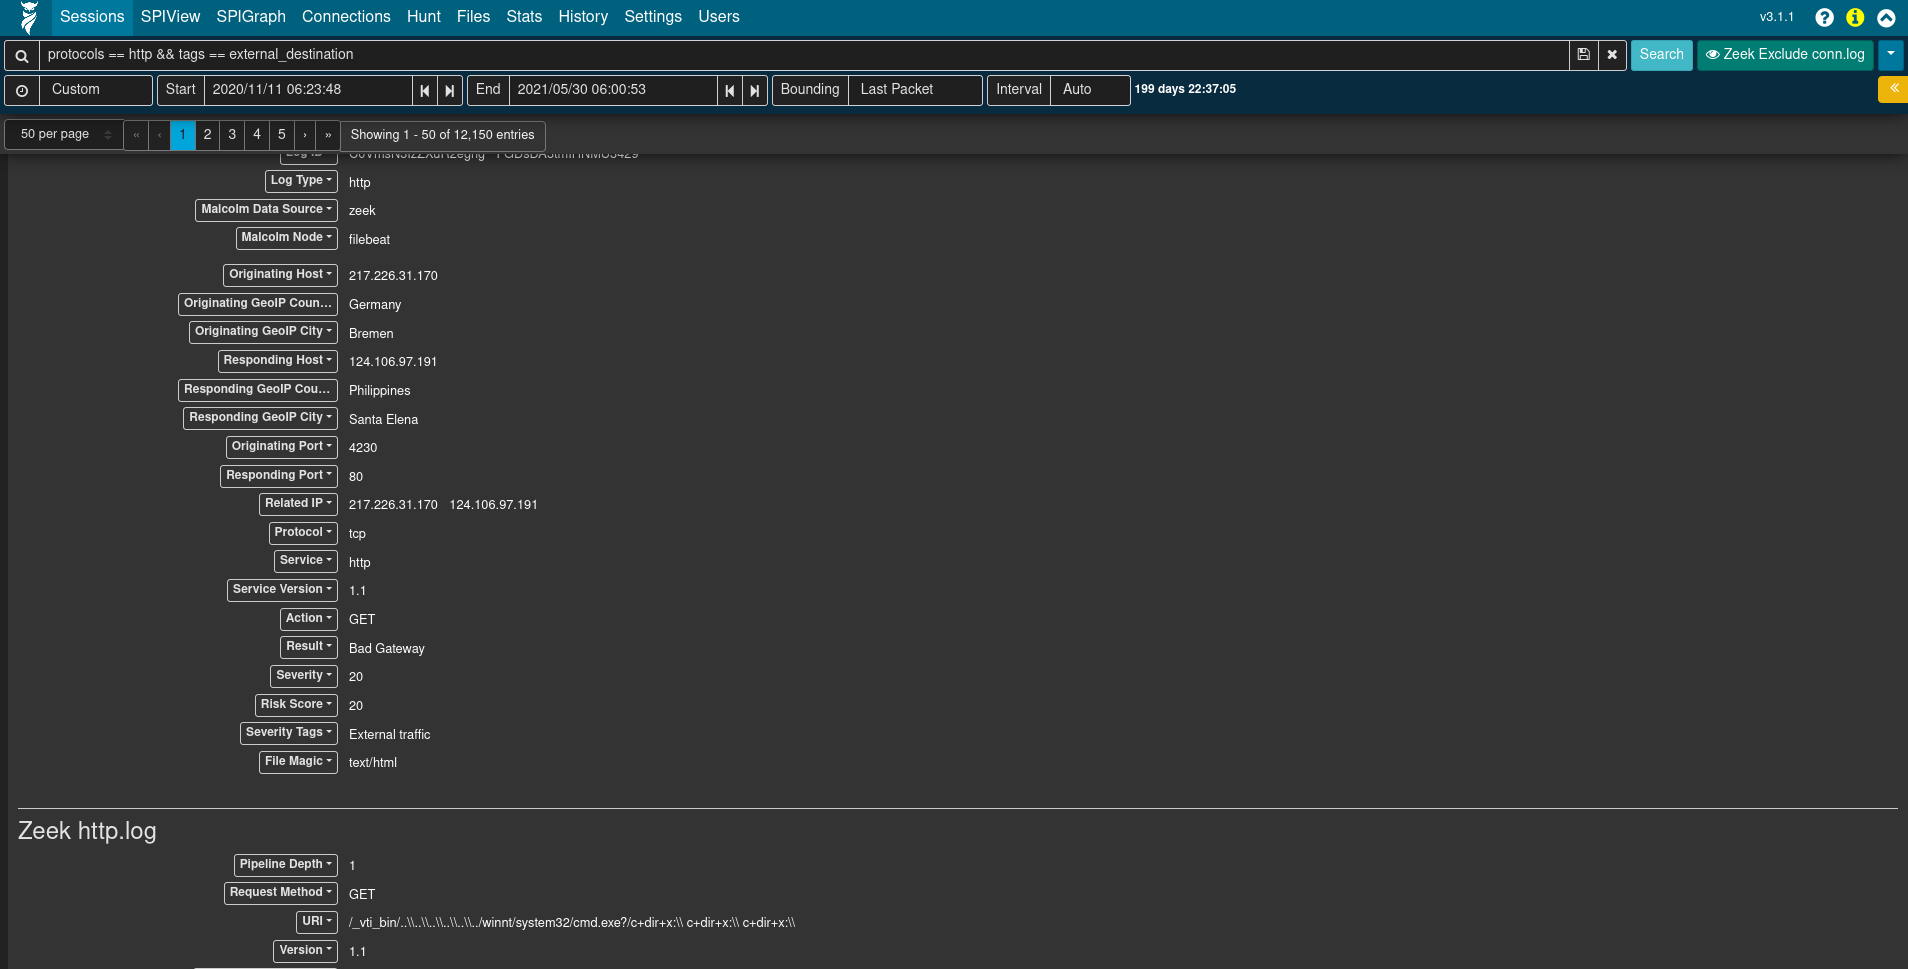
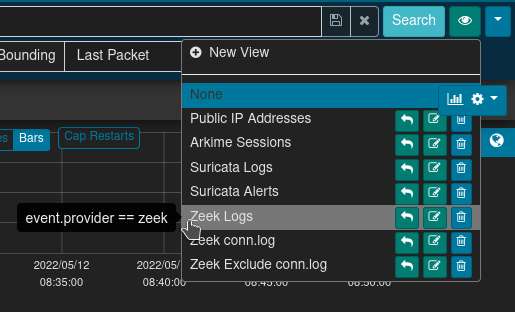
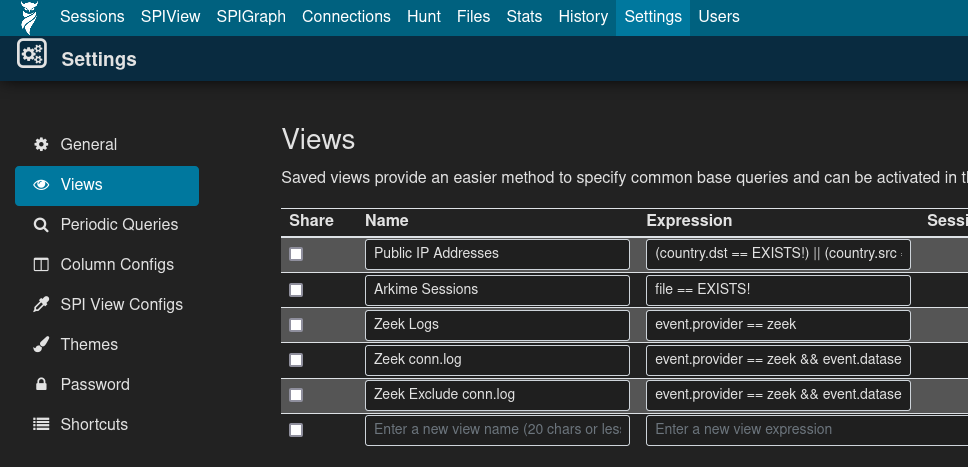
A few values of particular mention include Data Source (event.provider in OpenSearch), which can be used to distinguish from among the sources of the network traffic metadata record (e.g., zeek for Zeek logs and arkime for Arkime sessions); and, Log Type (event.dataset in OpenSearch), which corresponds to the kind of Zeek .log file from which the record was created. In other words, a search could be restricted to records from conn.log by searching event.provider == zeek && event.dataset == conn, or restricted to records from weird.log by searching event.provider == zeek && event.dataset == weird.
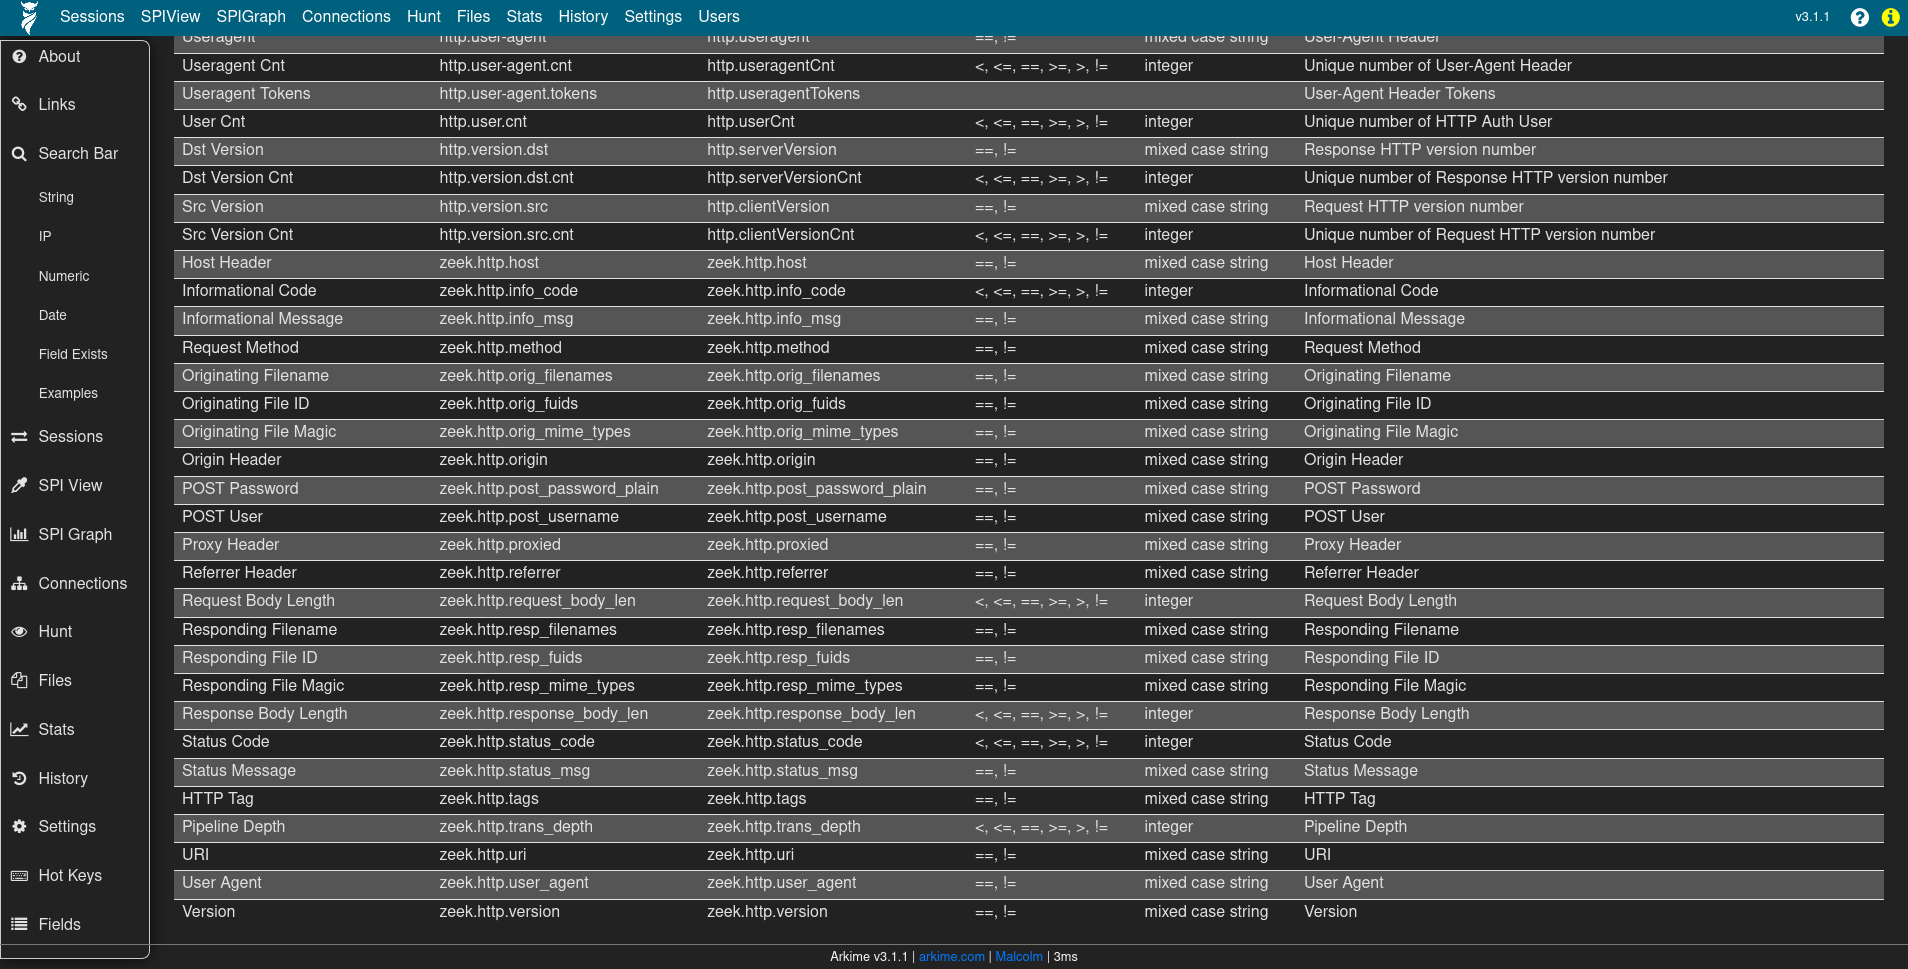
Click the icon of the owl 🦉 in the upper-left hand corner of to access the Arkime usage documentation (accessible at https://localhost/help if connecting locally), then click the Fields label in the navigation pane, then search for zeek to see a list of the other Zeek log types and fields available to Malcolm.
The values of records created from Zeek logs can be expanded and viewed like any native Arkime session by clicking the plus ➕ icon to the left of the record in the Sessions view. However, note that when dealing with these Zeek records the full packet contents are not available, so buttons dealing with viewing and exporting PCAP information will not behave as they would for records from PCAP files. Other than that, Zeek records and their values are usable in Malcolm just like native PCAP session records.
Correlating Zeek logs and Arkime sessions
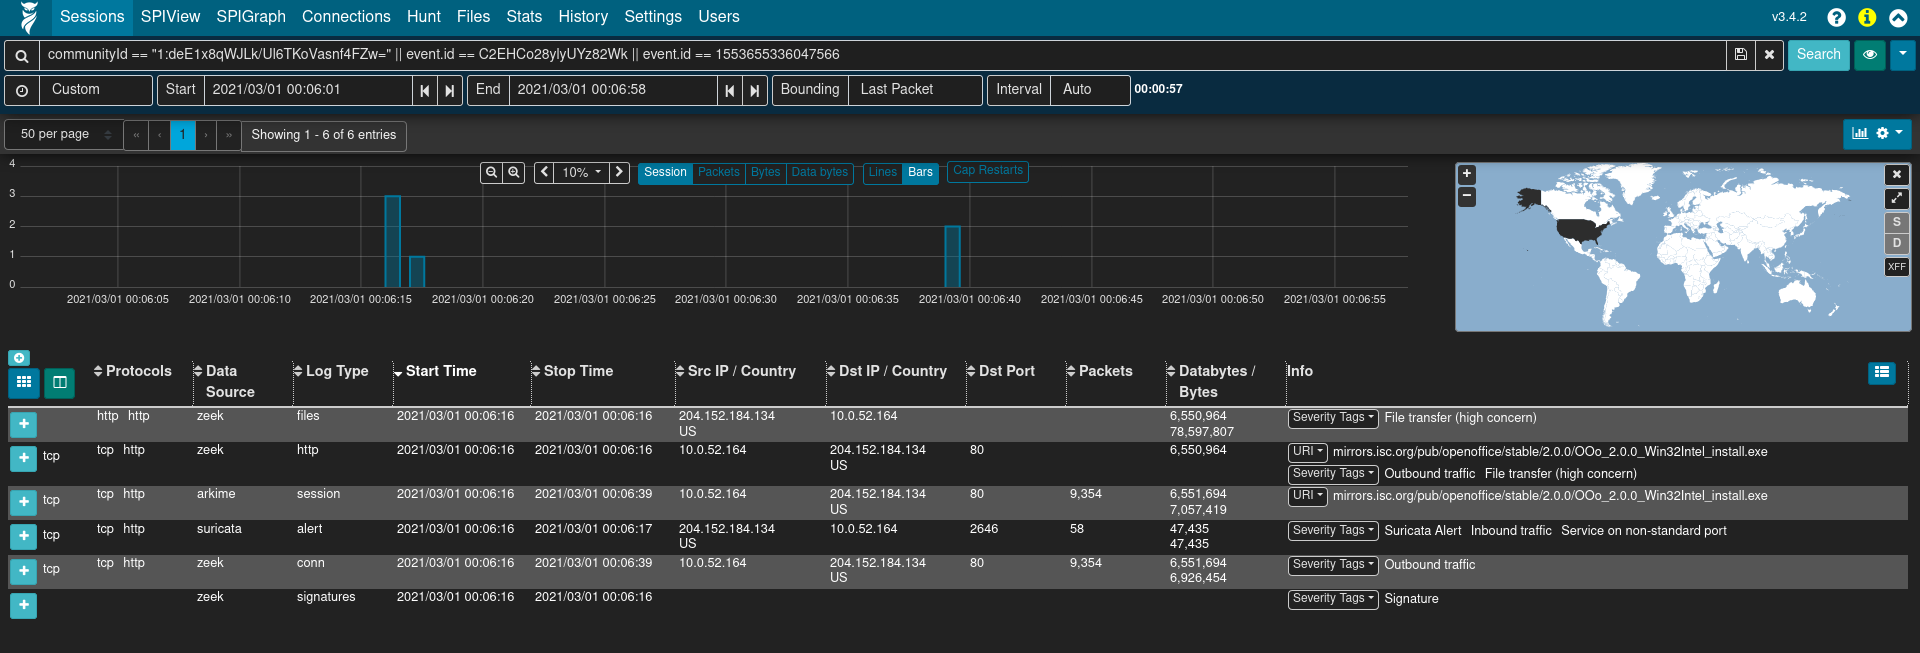
The Arkime interface displays both Zeek logs and Arkime sessions alongside each other. Using fields common to both data sources, users can craft queries to filter results matching desired criteria.
A few fields of particular mention that help limit returned results to those Zeek logs and Arkime session records generated from the same network connection are Community ID (network.community_id) and Zeek’s connection UID (zeek.uid), which Malcolm maps to both Arkime’s rootId field and the ECS event.id field.
Community ID is a specification for standard flow hashing published by Corelight with the intent of making it easier to pivot from one dataset (e.g., Arkime sessions) to another (e.g., Zeek conn.log entries). In Malcolm both Arkime and Zeek populate this value. This makes it possible to filter for a specific network connection and see both data sources’ results for that connection.
The rootId field is used by Arkime to link session records together when a particular session has too many packets to be represented by a single session. When normalizing Zeek logs to Arkime’s schema, Malcolm piggybacks on rootId to store Zeek’s connection UID to cross-reference entries across Zeek log types. The connection UID is also stored in zeek.uid.
Filtering on community ID OR’ed with zeek UID (e.g., network.community_id == "1:r7tGG//fXP1P0+BXH3zXETCtEFI=" || rootId == "CQcoro2z6adgtGlk42") is an effective way to see both the Arkime sessions and Zeek logs generated by a particular network connection.
Help
Click the owl 🦉 icon in the upper-left hand corner of to access the Arkime usage documentation (accessible at https://localhost/help if connecting locally), which includes such topics as search syntax, the Sessions view, SPIView, SPIGraph, and the Connections graph.
Sessions
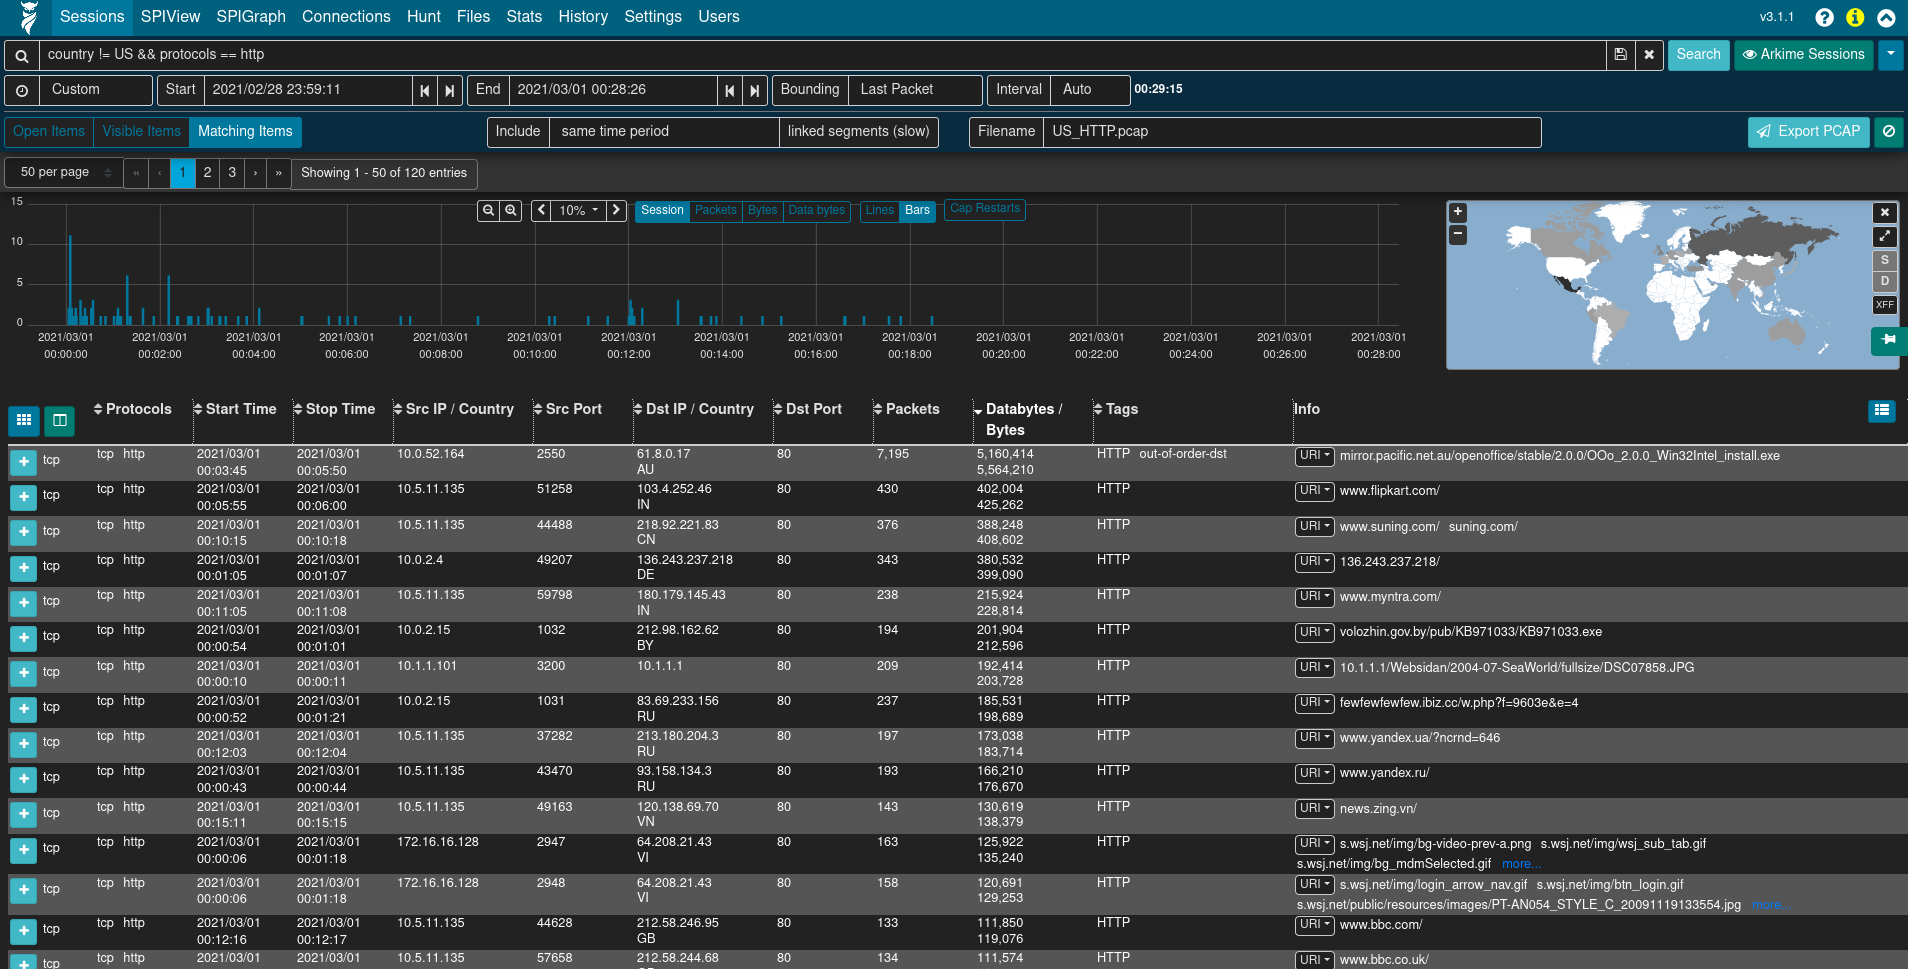
The Sessions view provides low-level details of the sessions being investigated, whether they be Arkime sessions created from PCAP files or Zeek logs mapped to the Arkime session database schema.
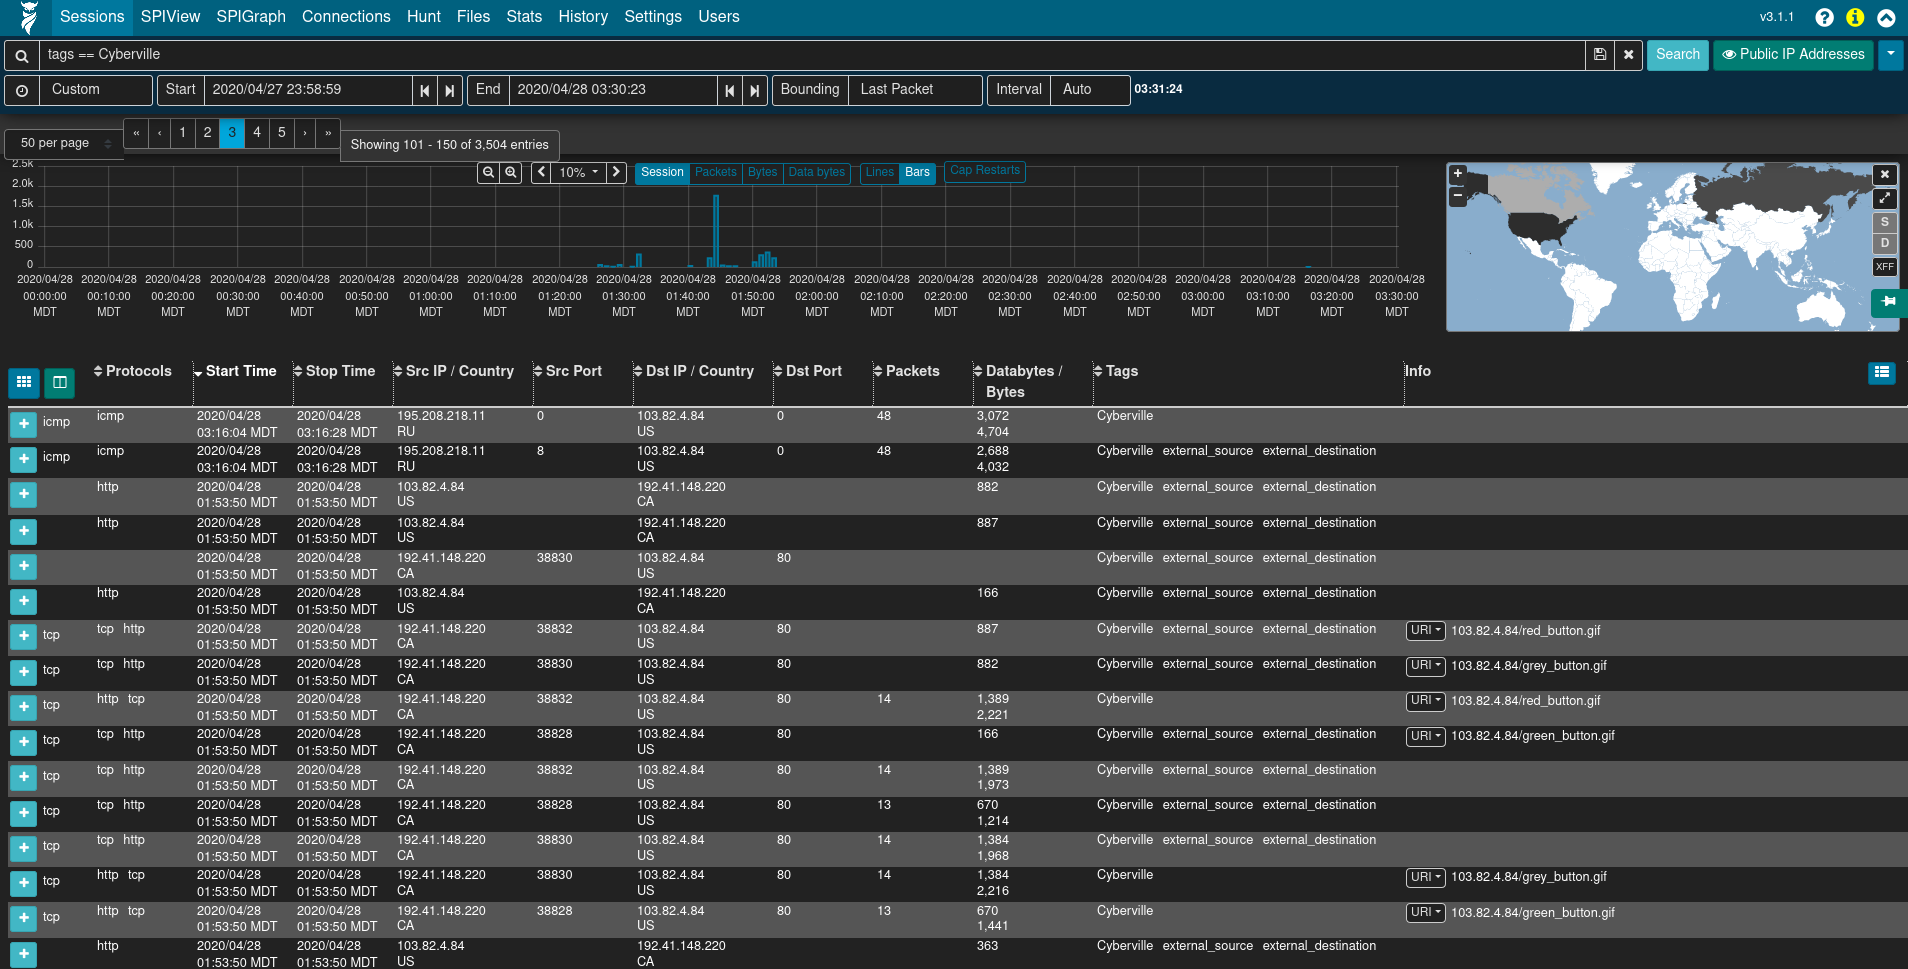
The Sessions view contains many filtering controls, allowing users to display all sessions or just sessions of interest, among other display options.
- search bar: Indicated by the magnifying glass 🔍 icon, the search bar allows defining filters on session/log metadata.
- time bounding controls: The 🕘, Start, End, Bounding, and Interval fields, and the date histogram can be used to visually zoom and pan the time range being examined.
- search button: The Search button re-runs the sessions query with the filters currently specified.
- views button: Indicated by the eyeball 👁 icon, views allow users to overlay additional, previously-specified filters onto the current sessions filters. For convenience, Malcolm provides several Arkime preconfigured views, including filtering on the
event.datasetfield. - map: A global map can be expanded by clicking the globe 🌎 icon. This allows filtering sessions by IP-based geolocation, when possible.
Some of these filter controls are also available on other Arkime pages (such as SPIView, SPIGraph, Connections, and Hunt).
The number of sessions displayed per page, as well as the page currently displayed, can be specified using the paging controls underneath the time bounding controls.
The sessions table is displayed below the filter controls. This table contains the sessions/logs matching the specified filters.
To the left of the column headers are two buttons. The Toggle visible columns button, indicated by a grid ⊞ icon, allows toggling which columns are displayed in the sessions table. The Save or load custom column configuration button, indicated by a columns ◫ icon, allows saving the current displayed columns or loading previously saved configurations. This is useful for customizing which columns are displayed when investigating different types of traffic. Column headers can also be clicked to sort the results in the table, and column widths may be adjusted by dragging the separators between column headers.
Details for individual sessions/logs can be expanded by clicking the plus ➕ icon on the left of each row. Each row may contain multiple sections and controls, depending on whether the row represents a Arkime session or a Zeek log. Clicking the field names and values in the details sections allows additional filters to be specified or summary lists of unique values to be exported.
When viewing Arkime session details (i.e., a session generated from a PCAP file), an additional packets section will be visible underneath the metadata sections. When the details of a session of this type are expanded, Arkime will read the packet(s) comprising the session for display here. Various controls can be used to adjust how the packet is displayed (enabling natural decoding and enabling Show Images & Files may produce visually pleasing results), and other options (including PCAP download, carving images and files, applying decoding filters, and examining payloads in CyberChef) are available.
See also Arkime’s usage documentation for more information on the Sessions view.
PCAP Export
Clicking the down arrow ▼ icon to the far right of the search bar presents a list of actions including PCAP Export (see Arkime’s sessions help for information on the other actions). When full PCAP sessions are displayed, the PCAP Export feature allows users to create a new PCAP file from the matching Arkime sessions, including controls for which sessions are included (open items, visible items, or all matching items) and whether or not to include linked segments. Click Export PCAP button to generate the PCAP, after which users will be presented with a browser download dialog to save or open the file. Note that depending on the scope of the filters specified this might take a long time (or, possibly even time out).
SPIView
Arkime’s SPI (Session Profile Information) View provides a quick and easy-to-use interface for exploring session/log metrics. The SPIView page lists categories for general session metrics (e.g., protocol, source and destination IP addresses, sort and destination ports, etc.) as well as for all of various types of network traffic understood by Malcolm. These categories can be expanded and the top n values displayed, along with each value’s cardinality, for the fields of interest they contain.
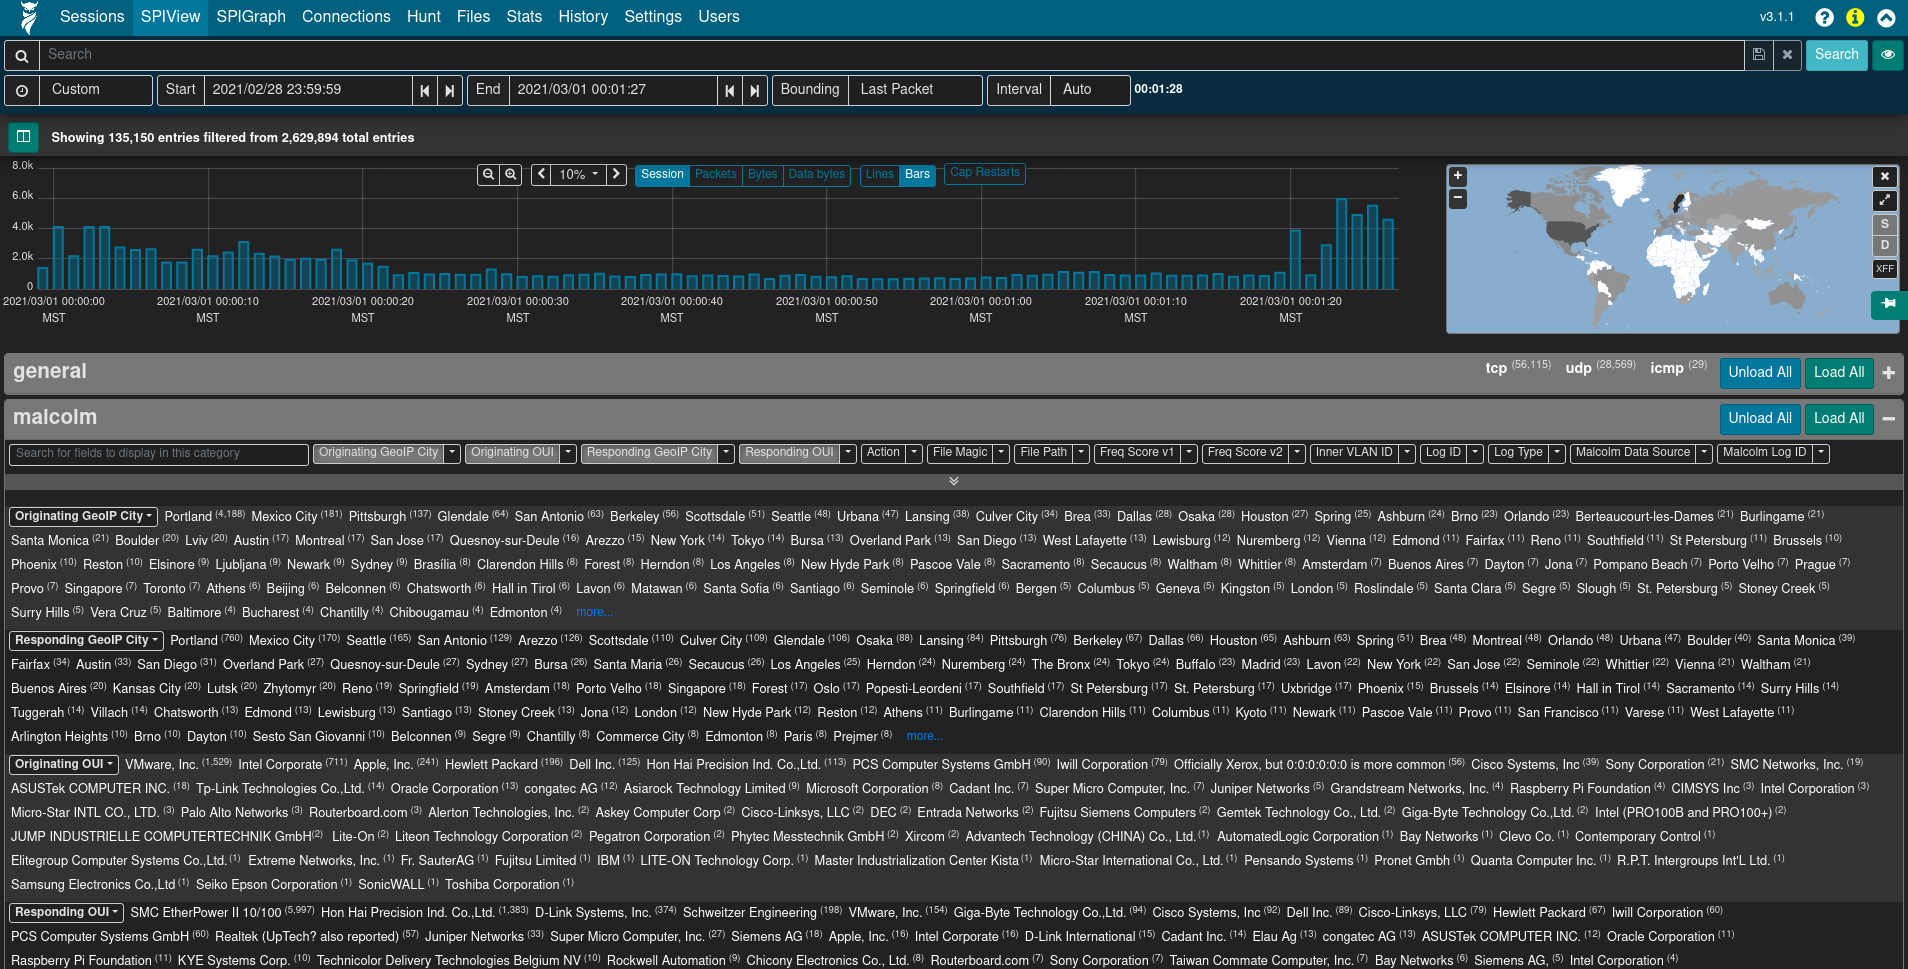
Click the the plus ➕ icon to the right of a category to expand it. The values for specific fields are displayed by clicking the field description in the field list underneath the category name. The list of field names can be filtered by typing part of the field name in the Search for fields to display in this category text input. The Load All and Unload All buttons can be used to toggle display of all fields belonging to that category. Once displayed, a field’s name or one of its values may be clicked to provide further actions for filtering or displaying that field or its values. Of particular interest may be the Open [fieldname] SPI Graph option when clicking on a field’s name. This will open a new tab with the SPI Graph (see below) populated with the field’s top values.
Note that because the SPIView page can run many queries, SPIView limits the search domain to 7 days (in other words, seven indices, as each index represents 1 day’s worth of data). When using SPIView, users will have best results by limiting the search time frame to less than or equal to 7 days. This limit can be adjusted by editing the spiDataMaxIndices setting in config.ini and rebuilding the ghcr.io/idaholab/malcolm/arkime container.
See also Arkime’s usage documentation for more information on SPIView.
SPIGraph
Arkime’s SPI (Session Profile Information) Graph visualizes the occurrence of some fields’ top n values over time, and (optionally) by location. This is particularly useful for identifying trends in a particular type of communication over time: traffic using a particular protocol when seen sparsely at regular intervals on that protocol’s date histogram in the SPIGraph may indicate a connection check, polling, or beaconing (for example, see the llmnr protocol in the screenshot below).
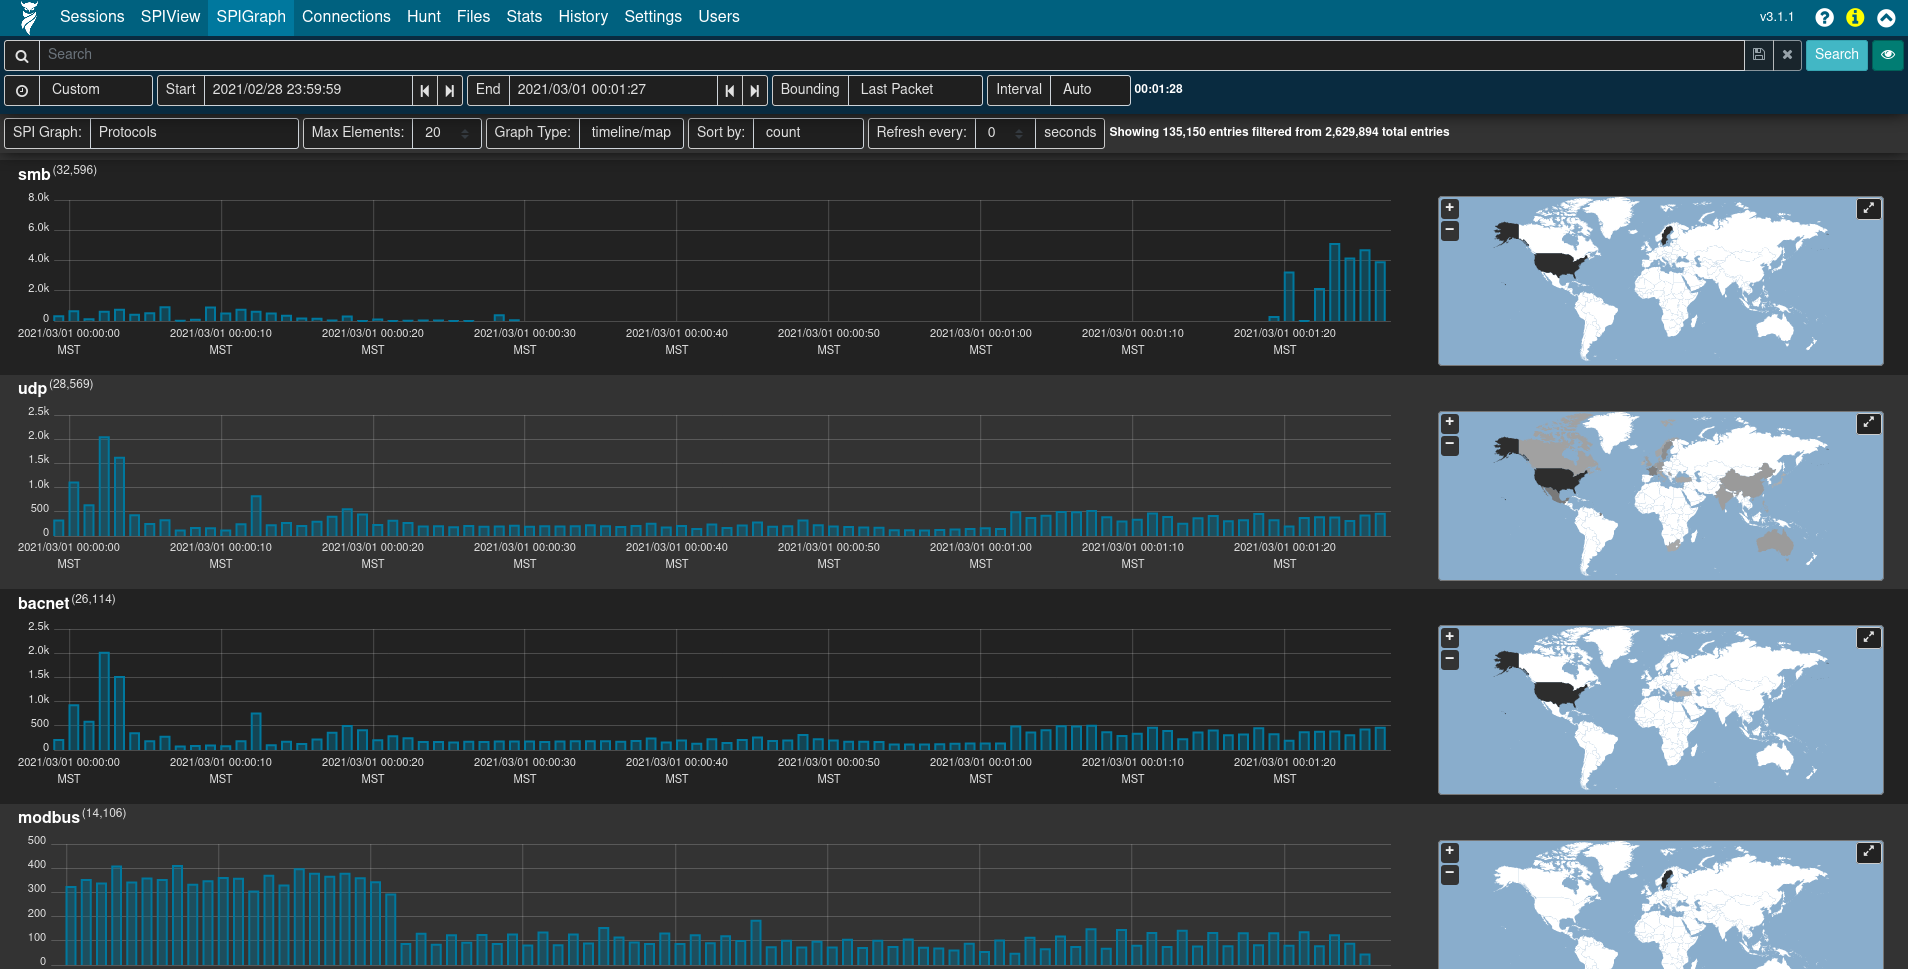
Controls can be found underneath the time bounding controls for selecting the field of interest, the number of elements to be displayed, the sort order, and a periodic refresh of the data.
See also Arkime’s usage documentation for more information on SPIGraph.
Connections
The Connections page presents network communications via a force-directed graph, making it easy to visualize logical relationships between network hosts.
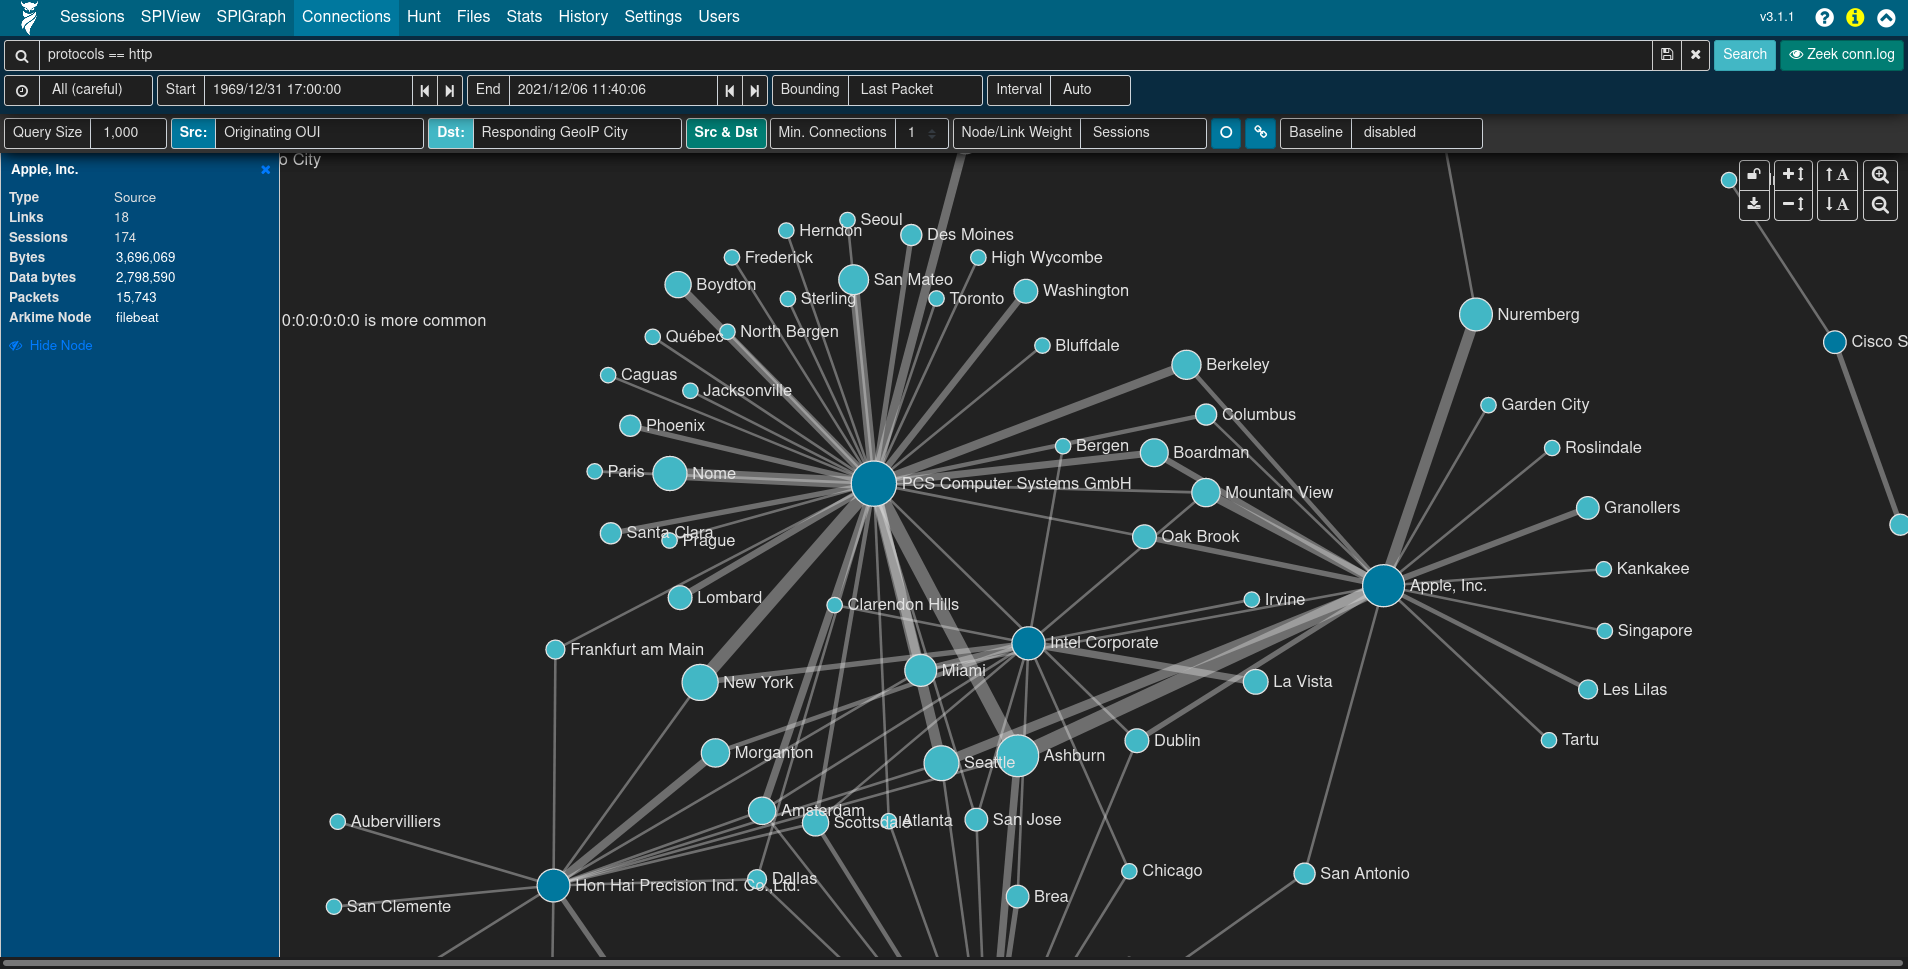
Controls are available for specifying the query size (where smaller values will execute more quickly but may only contain an incomplete representation of the top n sessions, and larger values may take longer to execute but will be more complete), which fields to use as the source and destination for node values, a minimum connections threshold, and the method for determining the “weight” of the link between two nodes. As is the case with most other visualizations in Arkime, this graph is interactive: clicking on a node or the link between two nodes can be used to modify query filters, and the nodes themselves may be repositioned by dragging-and-dropping them. A node’s color indicates whether it communicated as a source/originator, a destination/responder, or both.
While the default source and destination fields are Src IP and Dst IP:Dst Port, the Connections view is able to use any combination of fields. For example:
- Src OUI and Dst OUI (hardware manufacturers)
- Src IP and Protocols
- Originating Network Segment and Responding Network Segment (see Asset Interaction Analysis)
- Originating GeoIP City and Responding GeoIP City
or any other combination of these or other fields.
See also Arkime’s usage documentation for more information on the Connections graph.
Hunt
Arkime’s Hunt feature allows an analyst to search within the packets themselves (including payload data) rather than simply searching the session metadata. The search string may be specified using ASCII (with or without case sensitivity), hex codes, or regular expressions. Once a hunt job is complete, matching sessions can be viewed in the Sessions view.
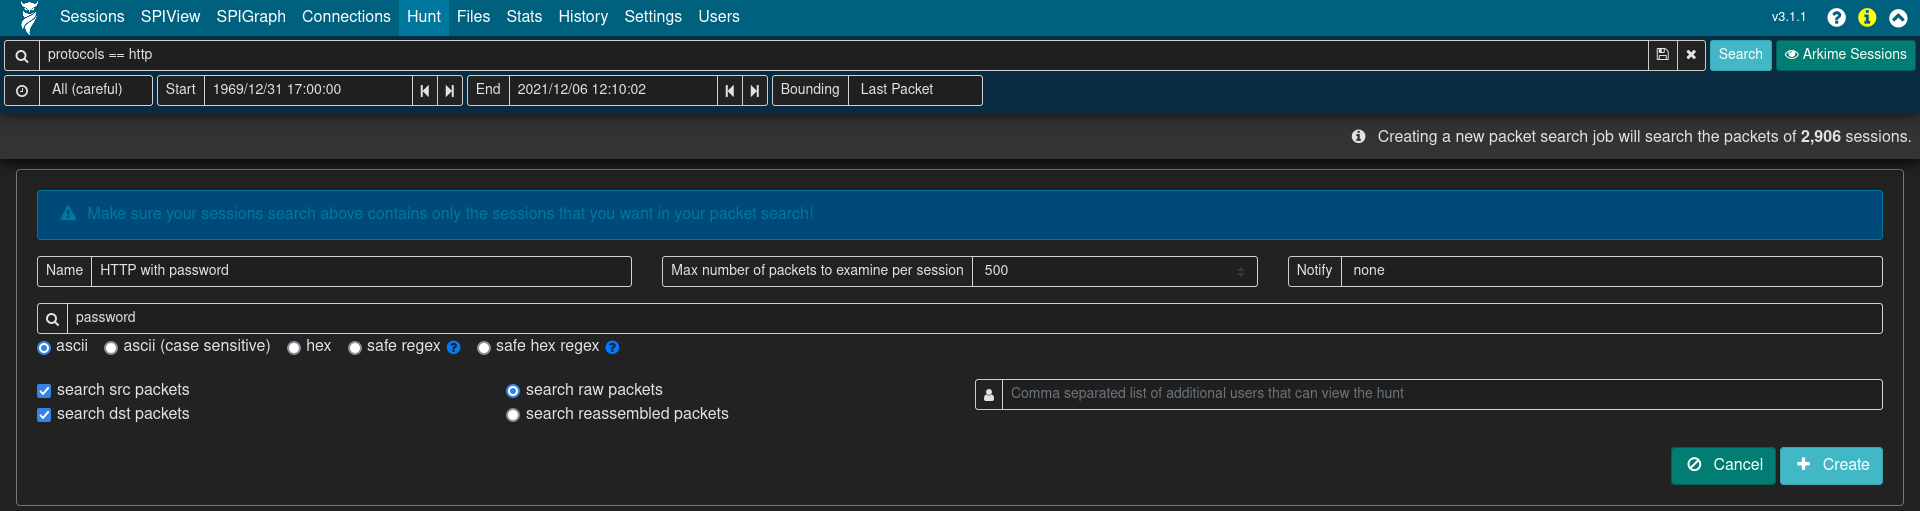
Clicking the Create a packet search job on the Hunt page will allow users to specify the following parameters for a new hunt job:
- a packet search job name
- a maximum number of packets to examine per session
- the search string and its format (ascii, ascii (case sensitive), hex, regex, or hex regex)
- whether to search source packets, destination packets, or both
- whether to search raw or reassembled packets
Click the ➕ Create button to begin the search. Arkime will scan the source PCAP files from which the sessions were created, according to the search criteria. Note that whatever filters were specified when the hunt job is executed will apply to the hunt job as well; the number of sessions matching the current filters will be displayed above the hunt job parameters with text such as “ⓘ Creating a new packet search job will search the packets of # sessions.”
Once a hunt job is submitted, it will be assigned a unique hunt ID (a long unique string of characters such as yuBHAGsBdljYmwGkbEMm) and its progress will be updated periodically in the Hunt Job Queue with data points such as the execution percent complete, the number of matches found so far, and the other parameters with which the job was submitted. More details for the hunt job can be viewed by expanding its row with the plus ➕ icon at left.
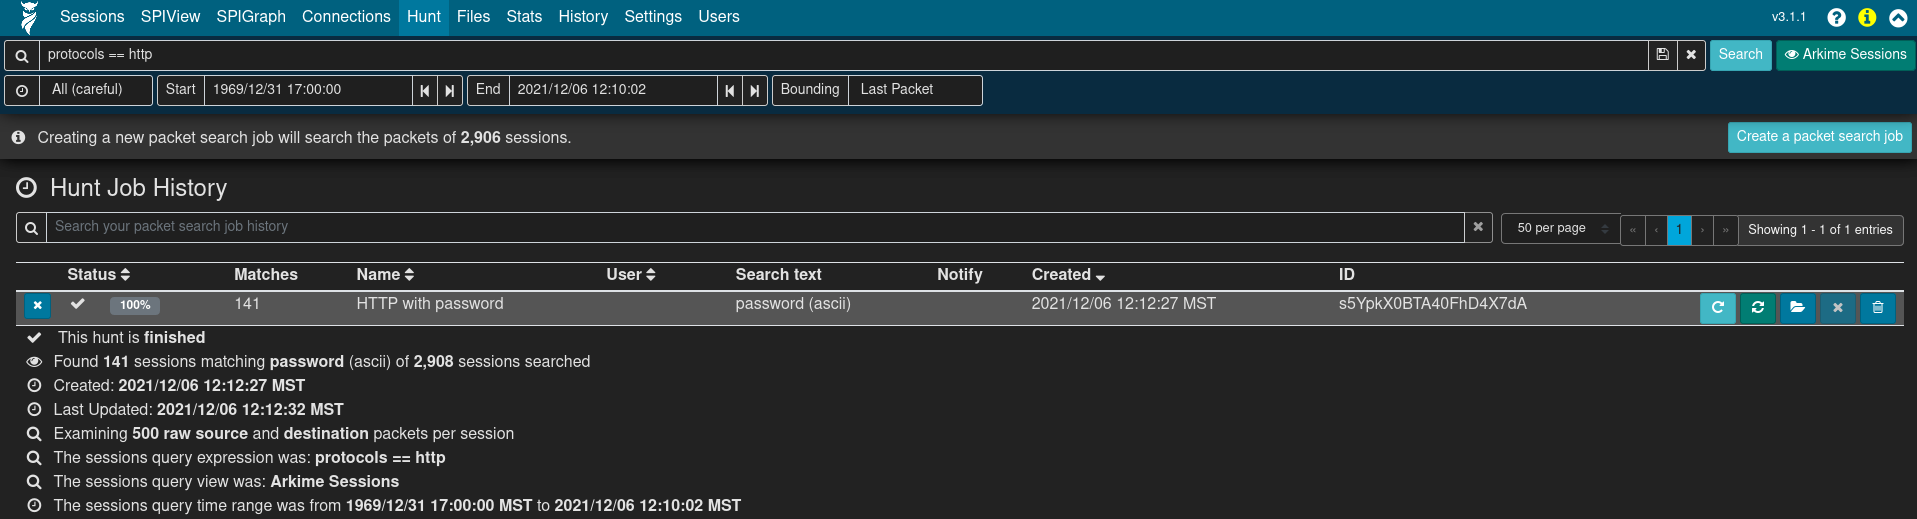
Once the hunt job is complete (and 1 minute or so has passed, as the huntId must be added to the matching session records in the database), click the folder 📂 icon on the right side of the hunt job row to open a new Sessions tab with the search bar prepopulated to filter to sessions with packets matching the search criteria.
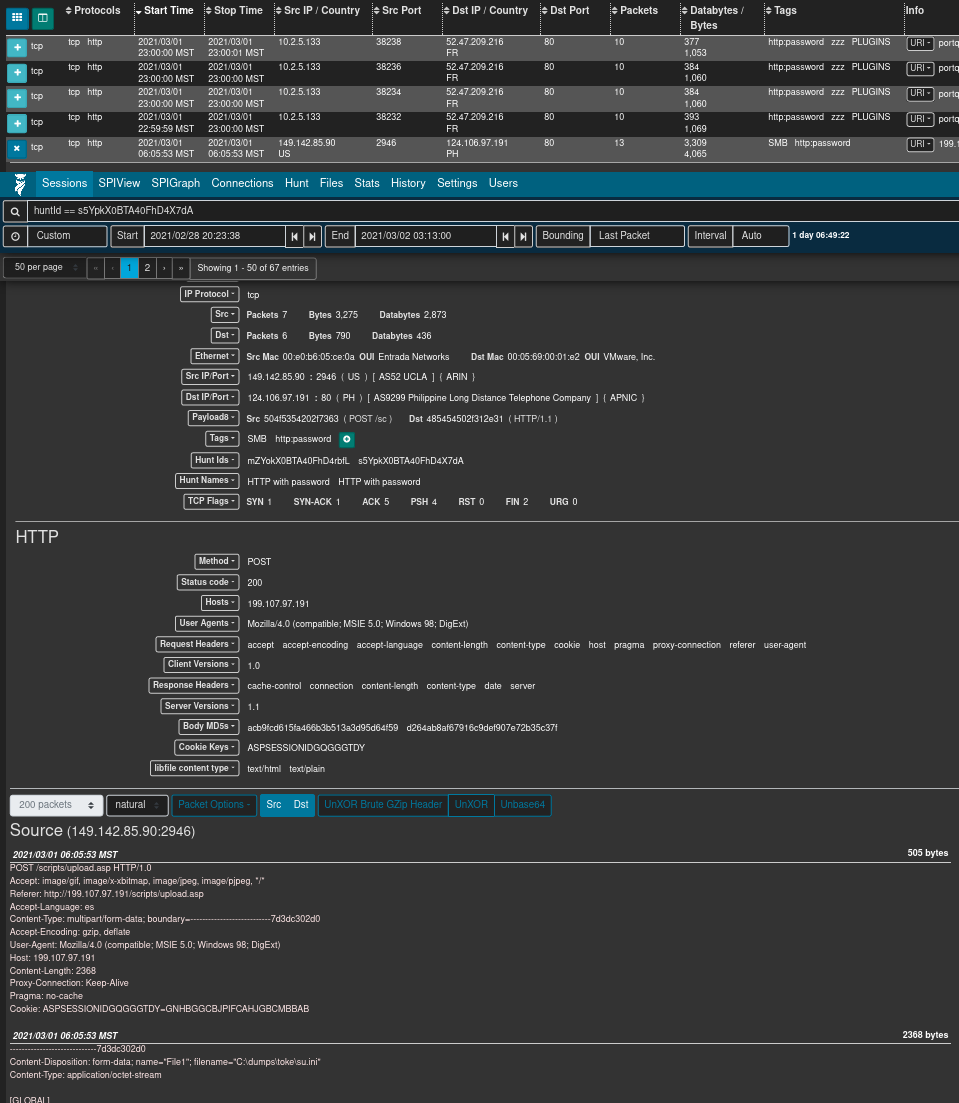
From this list of filtered sessions you can expand session details and explore packet payloads that matched the hunt search criteria.
The hunt feature is available only for sessions created from full packet capture data, not Zeek logs. This being the case, it is a good idea to click the eyeball 👁 icon and select the Arkime Sessions view to exclude Zeek logs from candidate sessions prior to using the hunt feature.
See also Arkime’s usage documentation for more information on the hunt feature.
Statistics
Arkime provides several other reports that show information about the state of Arkime and the underlying OpenSearch database.
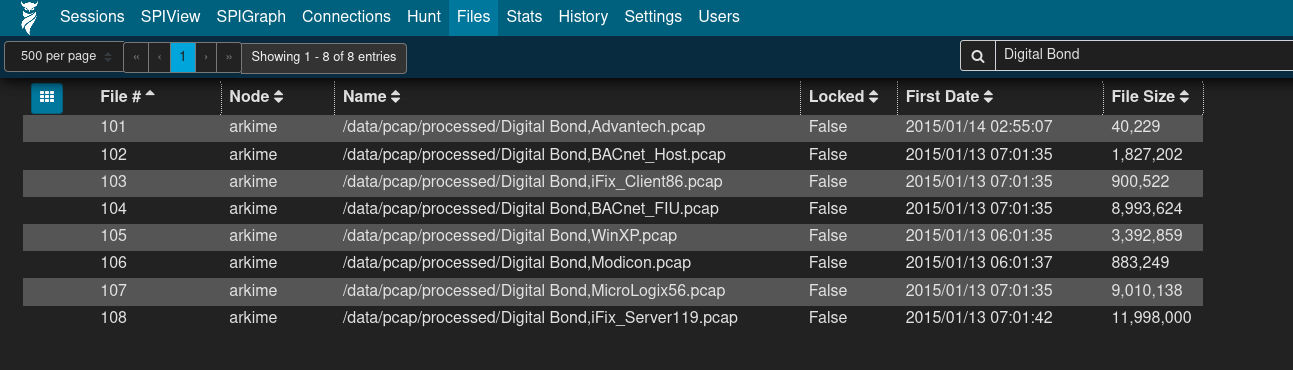
The Files list displays a list of PCAP files processed by Arkime, the date and time of the earliest packet in each file, and the file size:
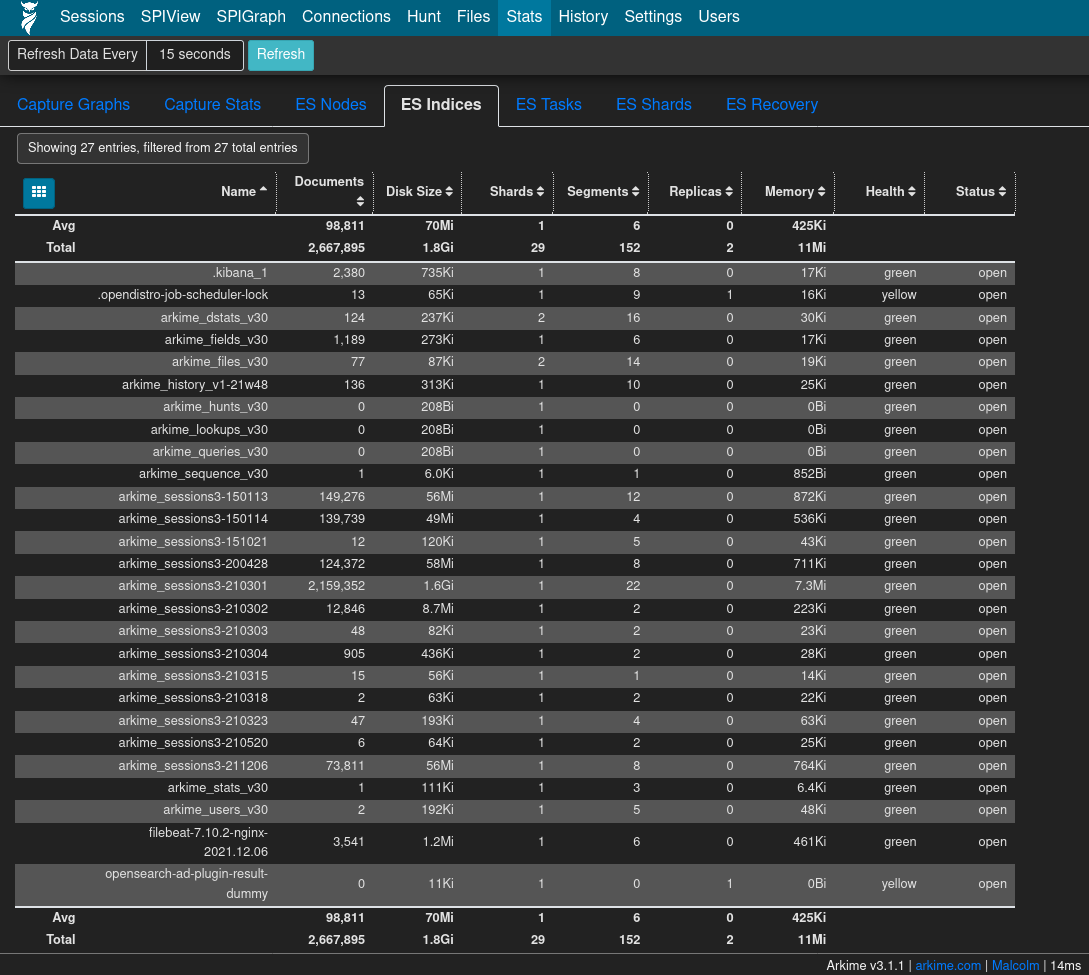
The ES Indices list (available under the Stats page) lists the OpenSearch indices within which log data is contained:
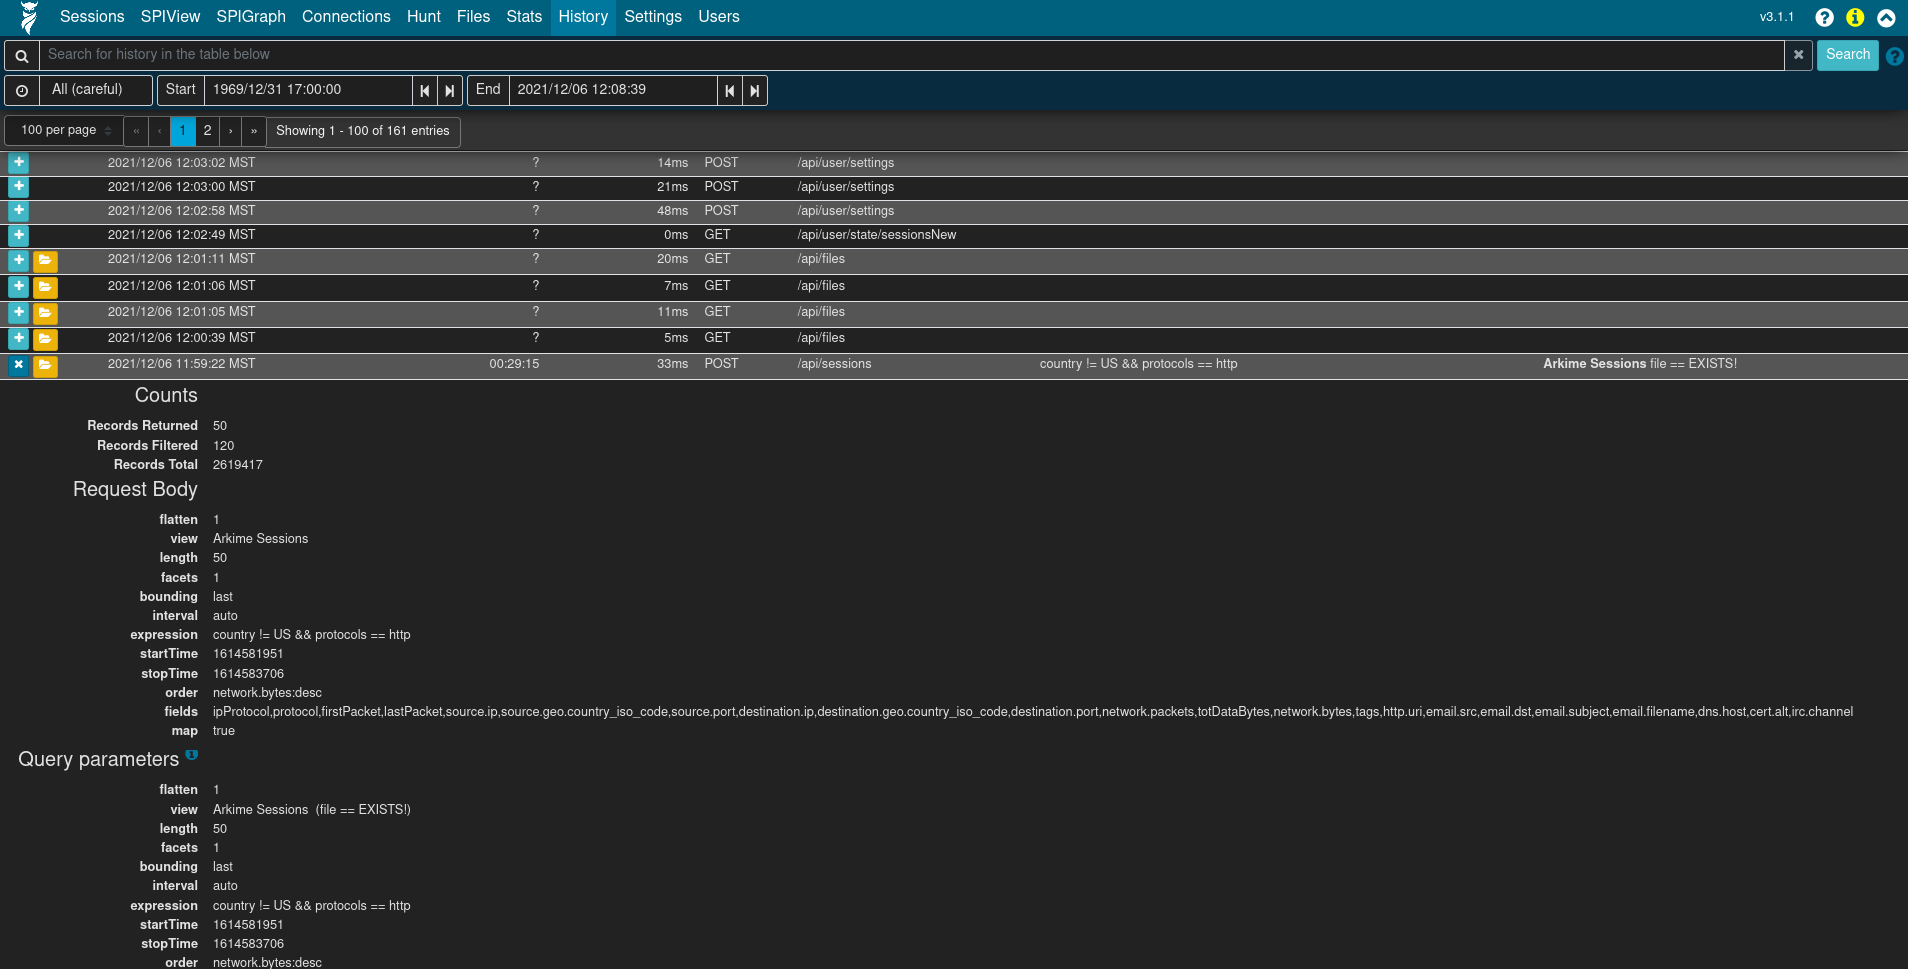
The History view provides a historical list of queries issues to Arkime and the details of those queries:
See also Arkime’s usage documentation for more information on the Files list, statistics, and history.
Settings
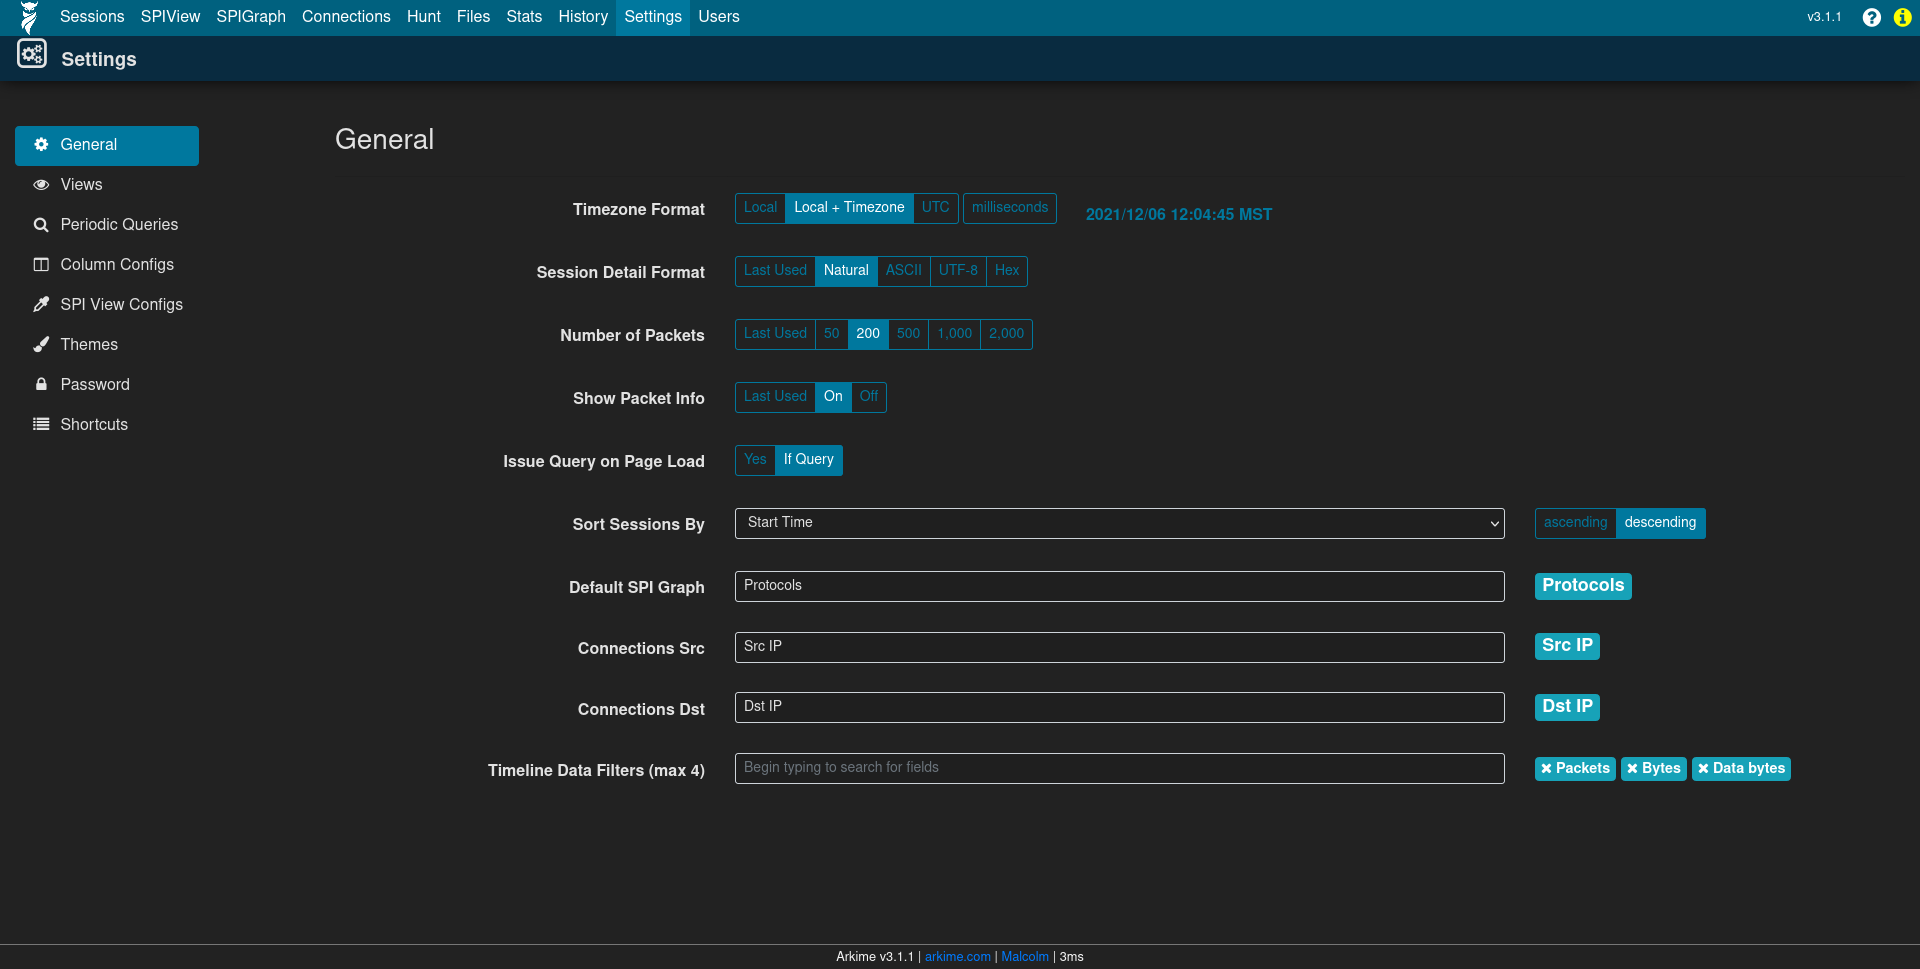
General settings
The Settings page can be used to tweak Arkime preferences, define additional custom views and column configurations, tweak the color theme, and more.
See Arkime’s usage documentation for more information on settings.
WISE
Arkime’s WISE plugin leverages data feeds to enhance Arkime’s logs. WISE is the successor to depricated tagger plugin.
See Arkime’s documentation for additional information on leveraging the WISE plugin.
For more information on configuring WISE within Malcolm, see the Arkime environment variables.
To leverage WISE when using a Hedgehog Linux, the sensor needs to be configured to request data from the WISE service. This can be setup during sensor configuration. See Configuring Communication Between Hedgehog and Malcolm for more information.