Logo

A powerful, easily deployable network traffic analysis tool suite

Quick Start

Documentation

Components

Supported Protocols

Configuring

Arkime

Dashboards

Hedgehog Linux

Contribution Guide

OpenSearch Dashboards

While Arkime provides very nice visualizations, especially for network traffic, OpenSearch Dashboards (an open-source general-purpose data visualization tool for OpenSearch) can be used to create custom visualizations (tables, charts, graphs, dashboards, etc.) using the same data.

The OpenSearch Dashboards container can be accessed at https://localhost/dashboards/ if connecting locally. Several preconfigured dashboards for Zeek logs are included in Malcolm’s OpenSearch Dashboards configuration.

OpenSearch Dashboards has several components for data searching and visualization:
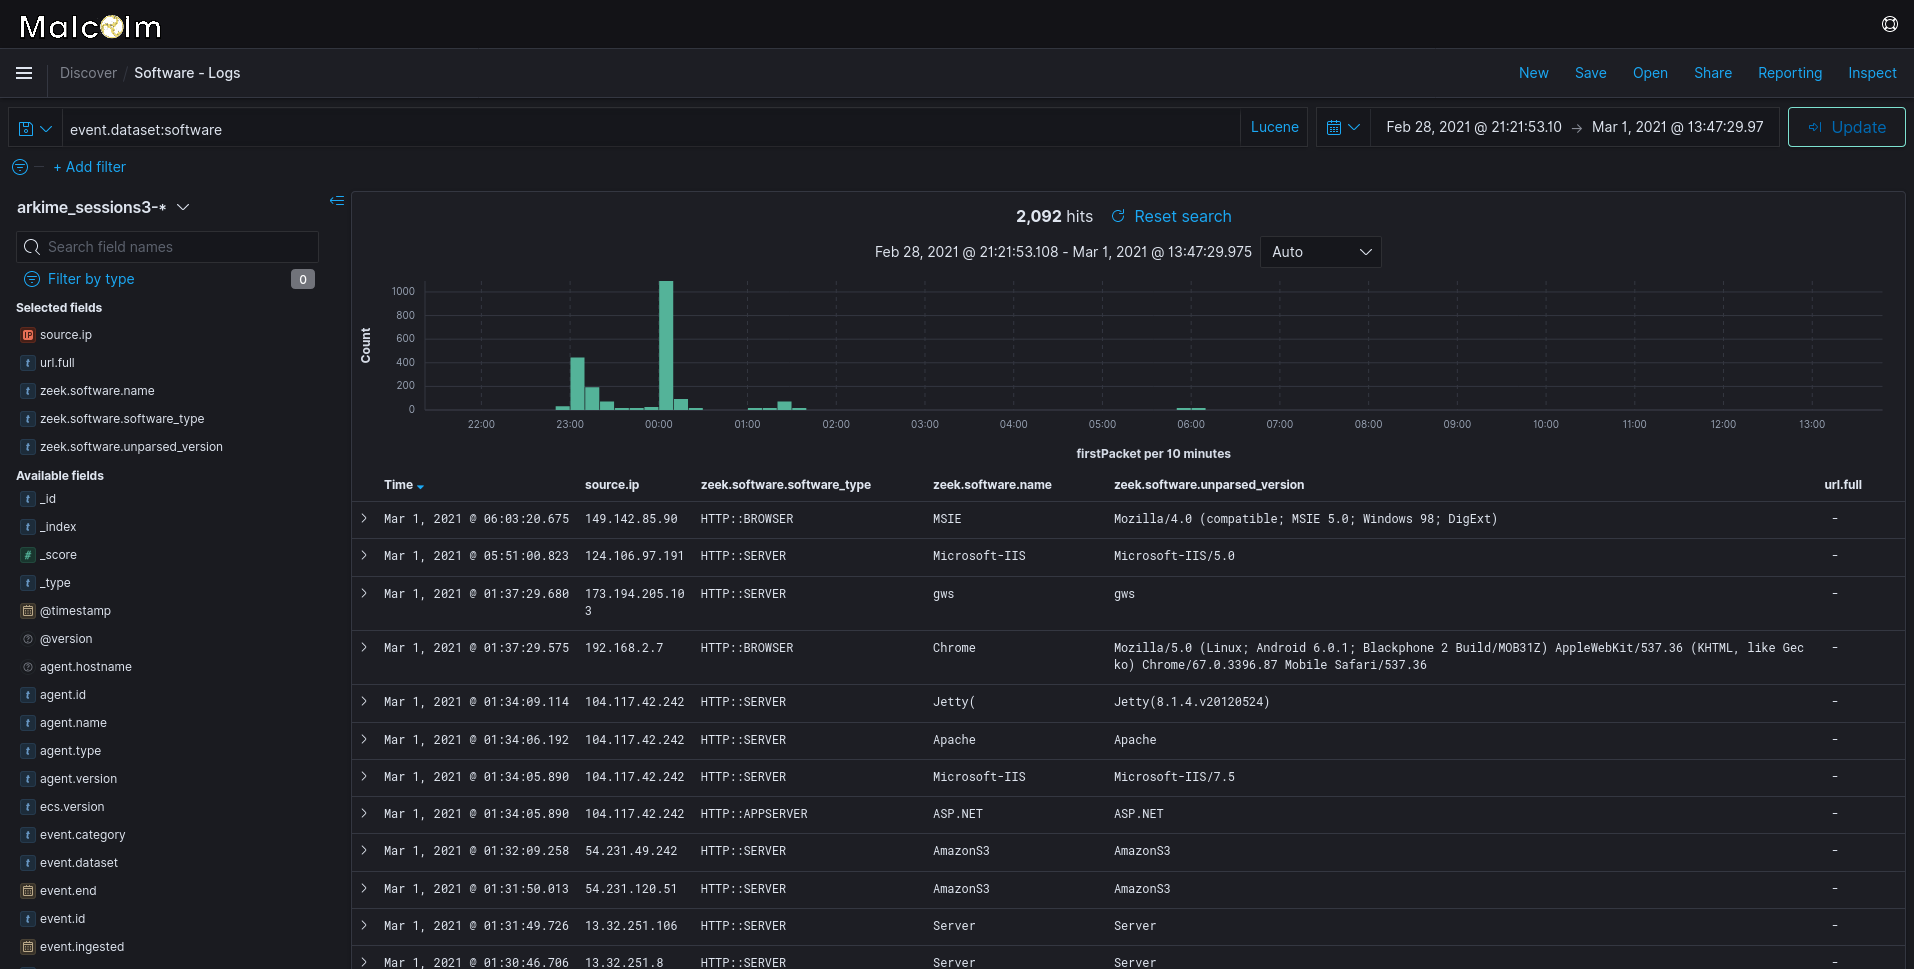
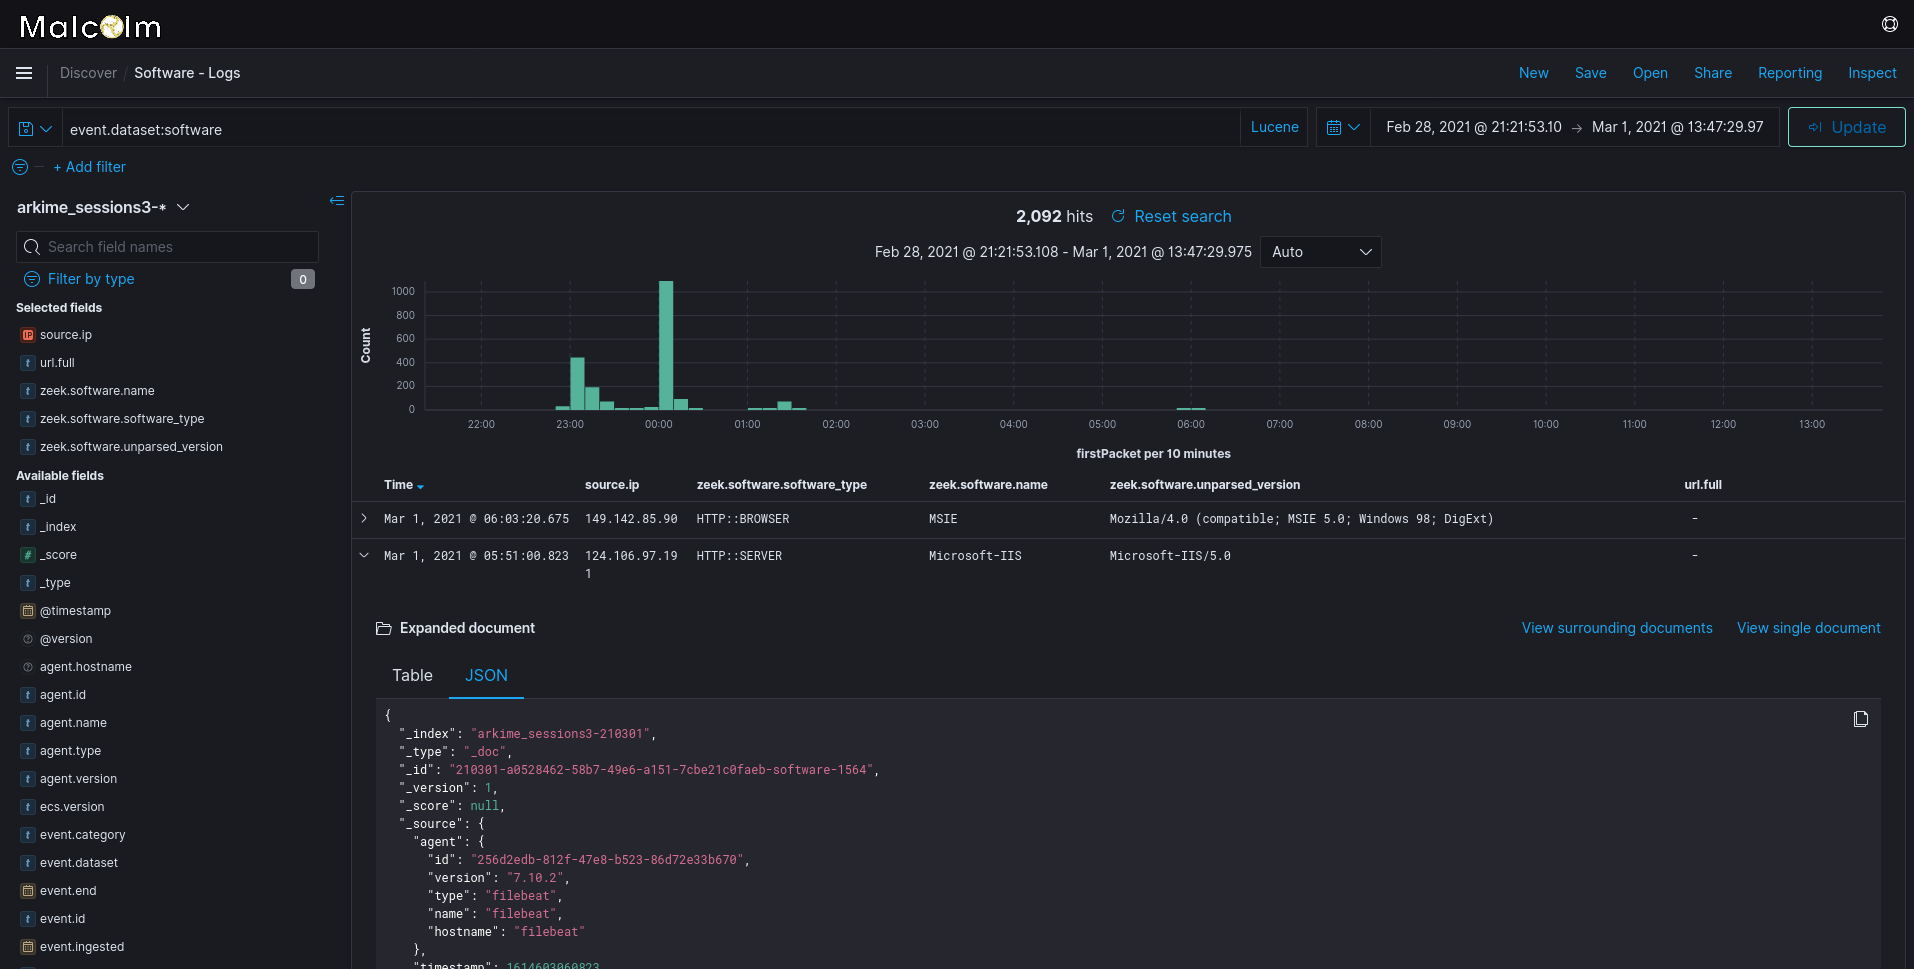
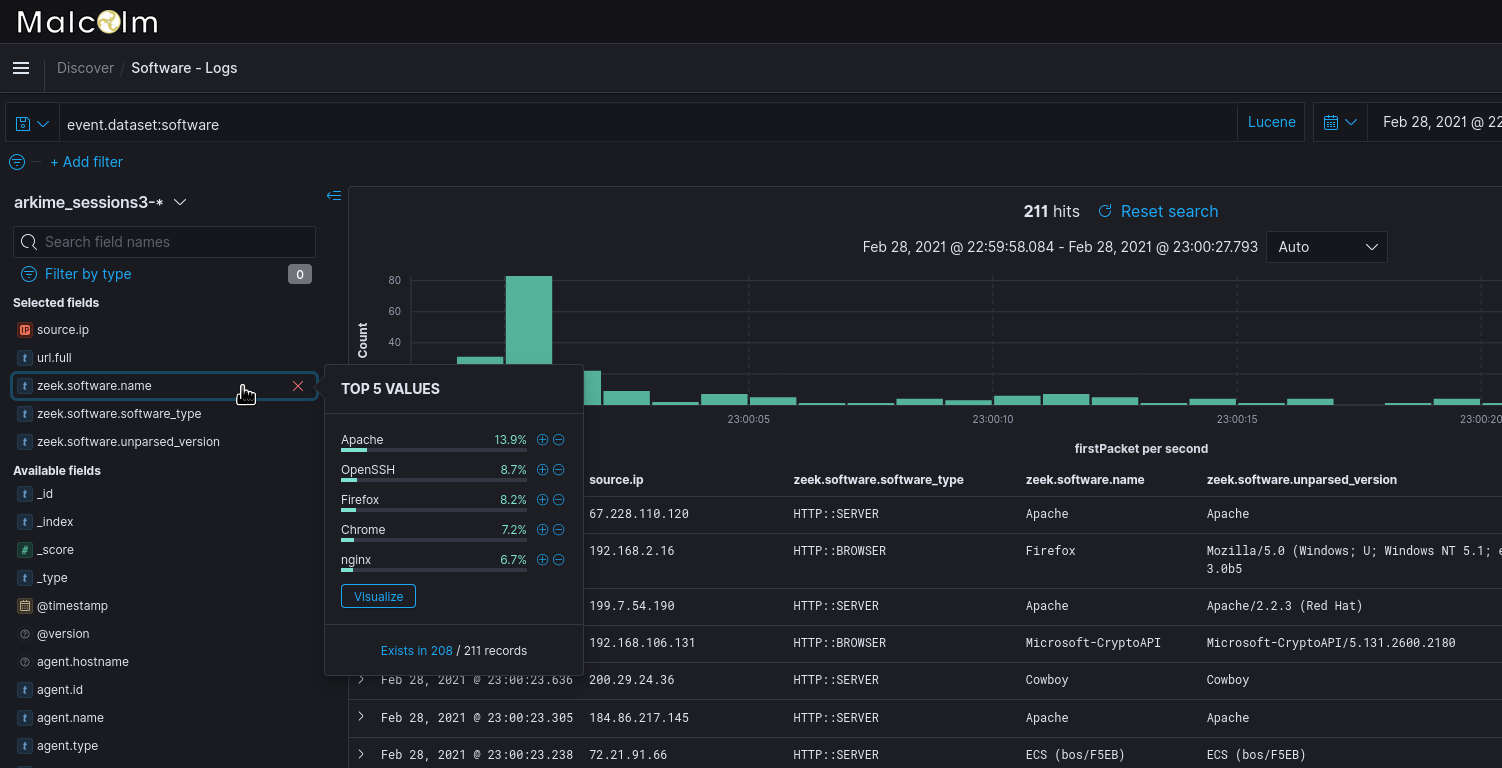
Discover

The Discover view enables users to view events on a record-by-record basis (similar to a session record in Arkime or an individual line from a Zeek log). See the official Kibana User Guide (OpenSearch Dashboards is an open-source fork of Kibana, which is no longer open-source software) for information on using the Discover view:

Screenshots

Discover view

Viewing the details of a session in Discover

Filtering by tags to display only sessions with public IP addresses

Changing the fields displayed in Discover

Opening a previously-saved search

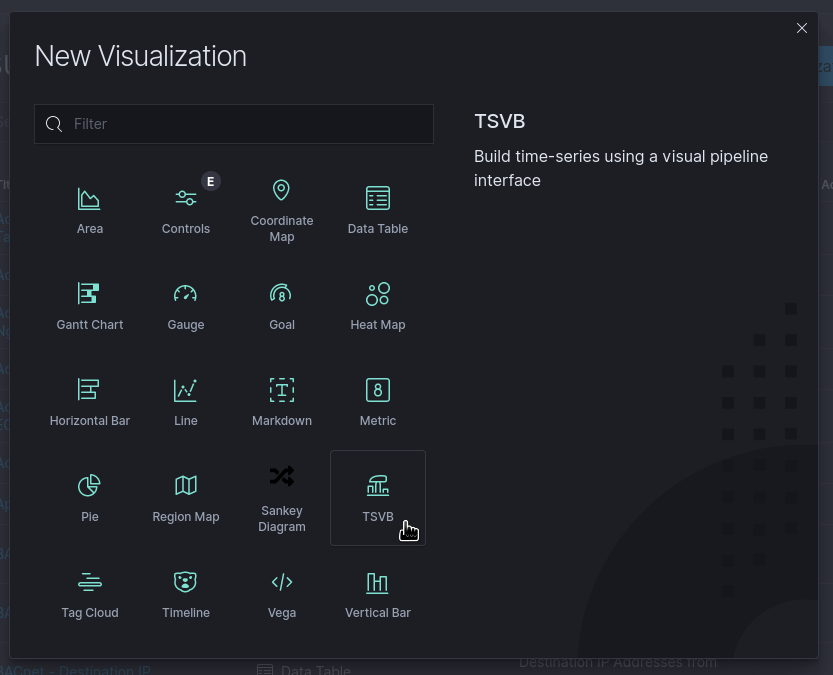
Visualizations and dashboards

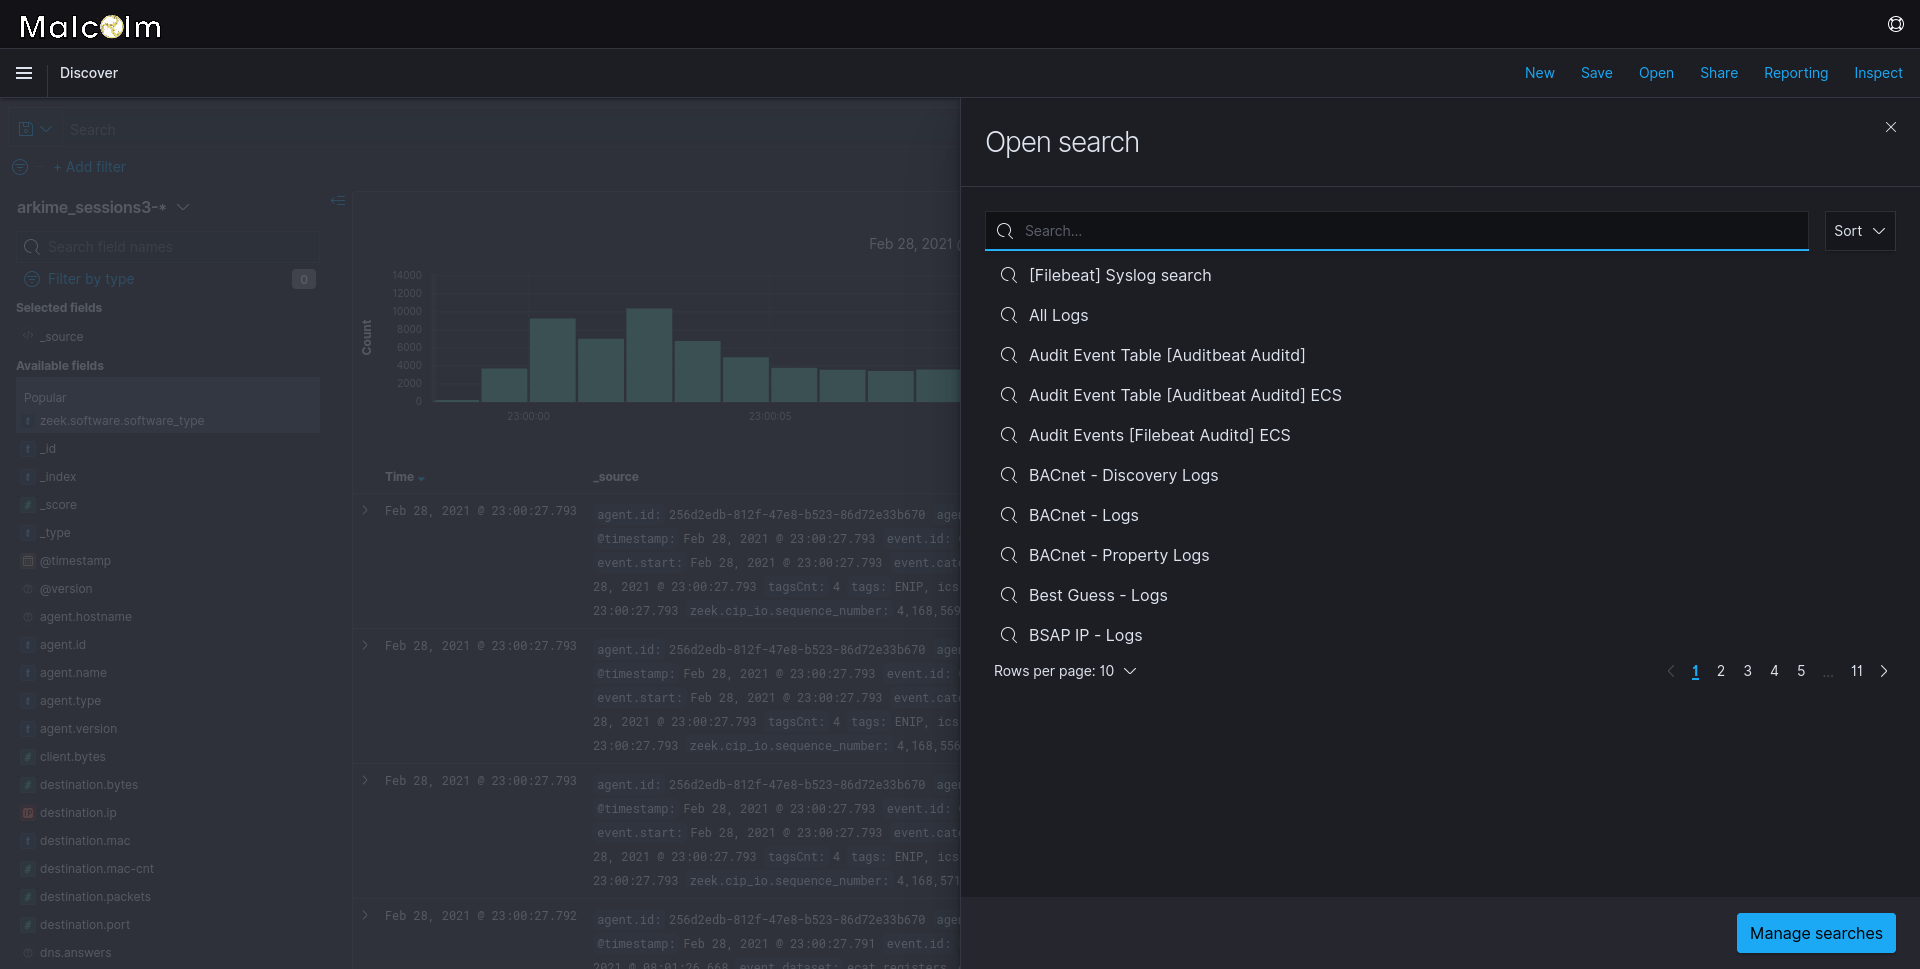
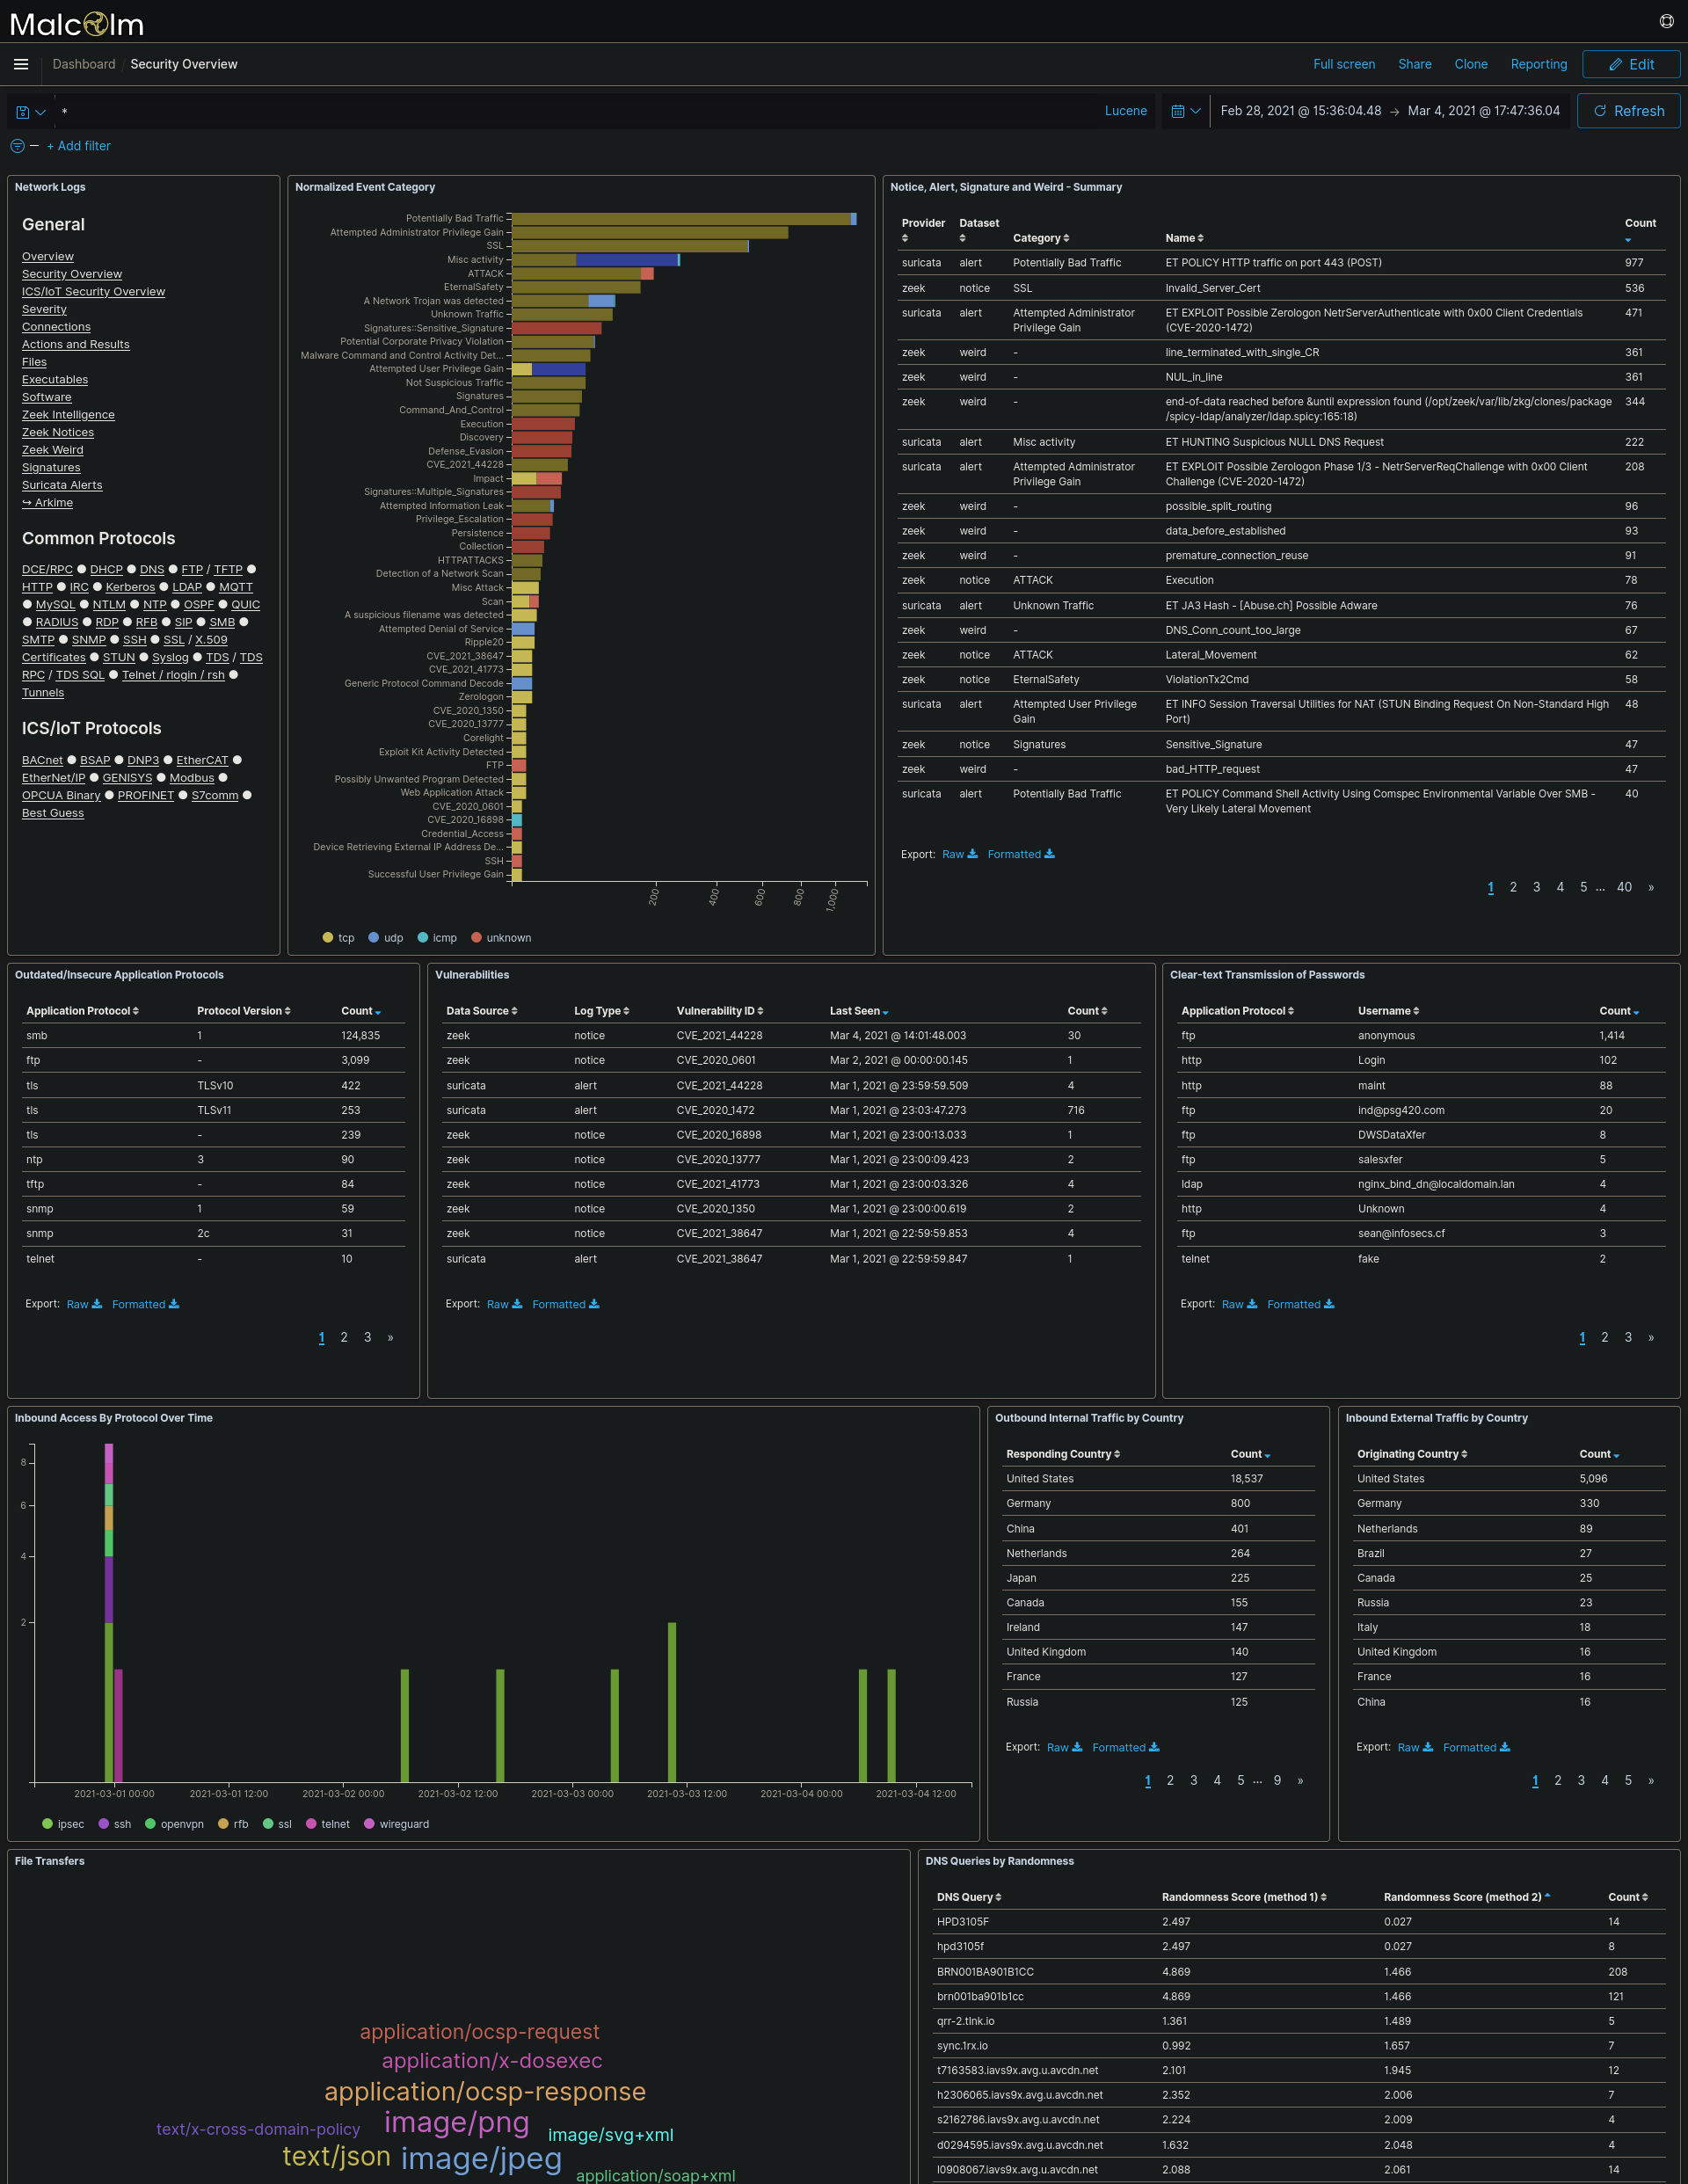
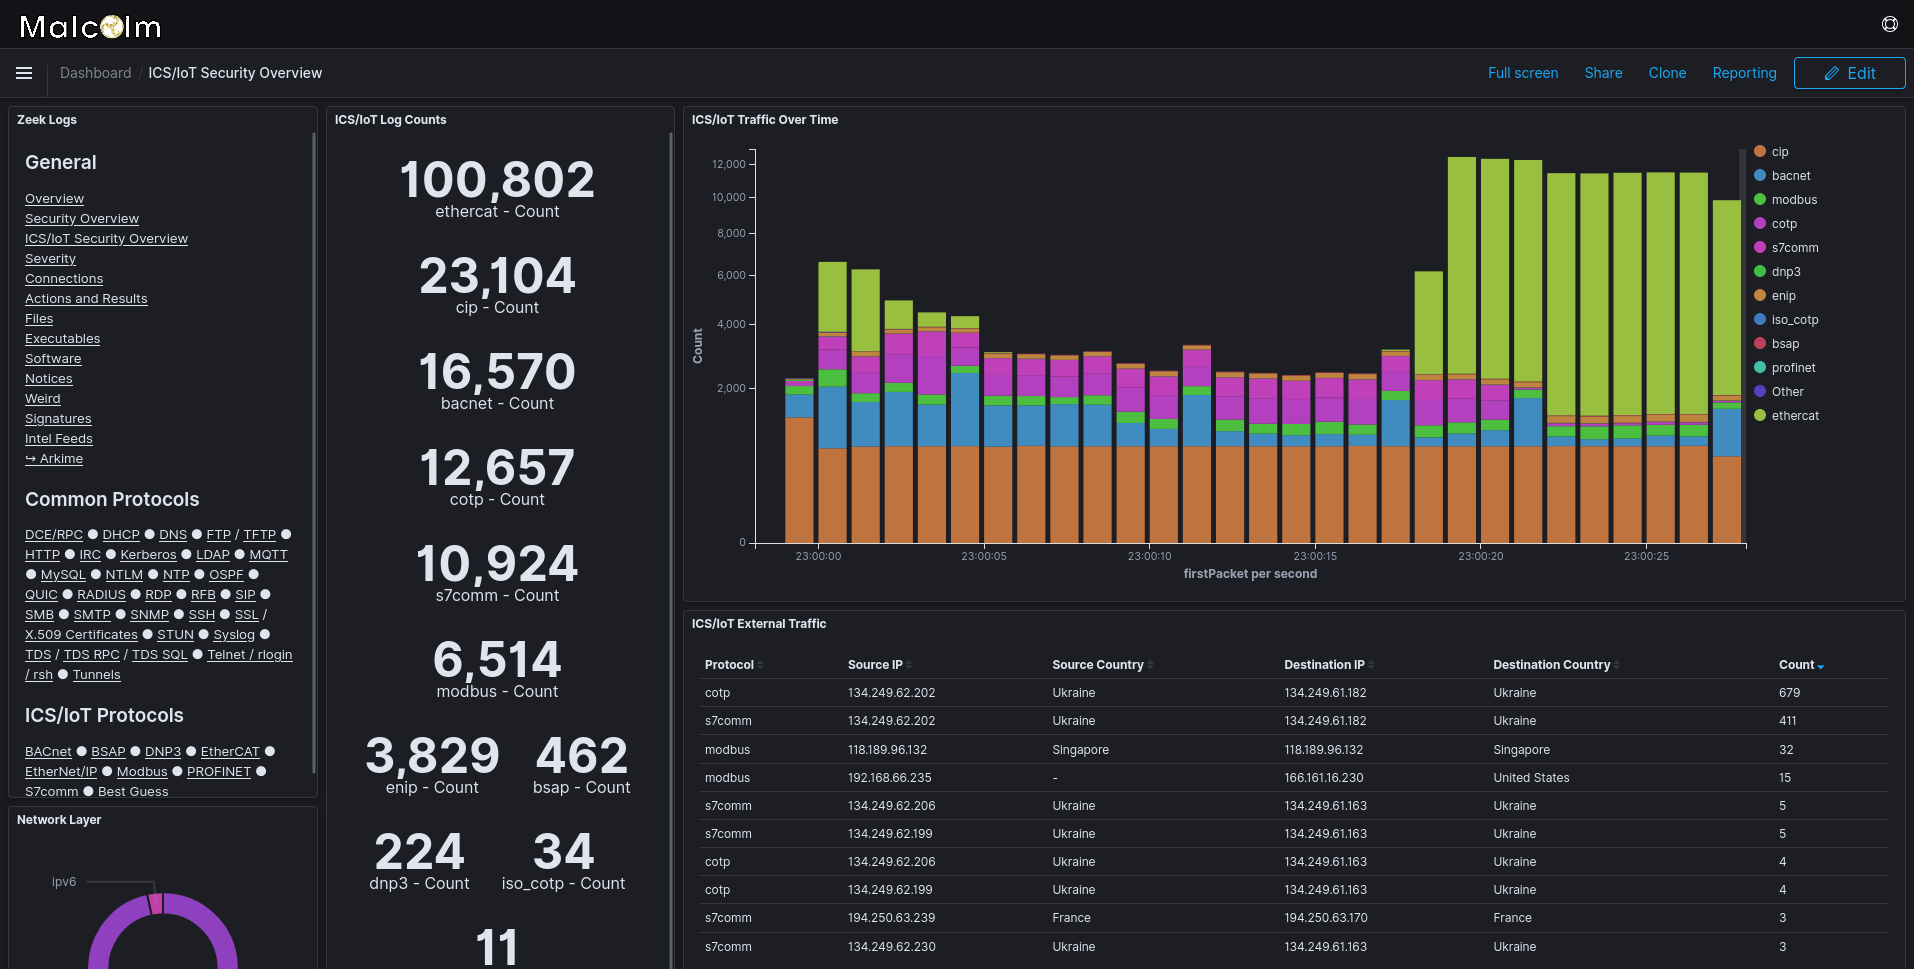
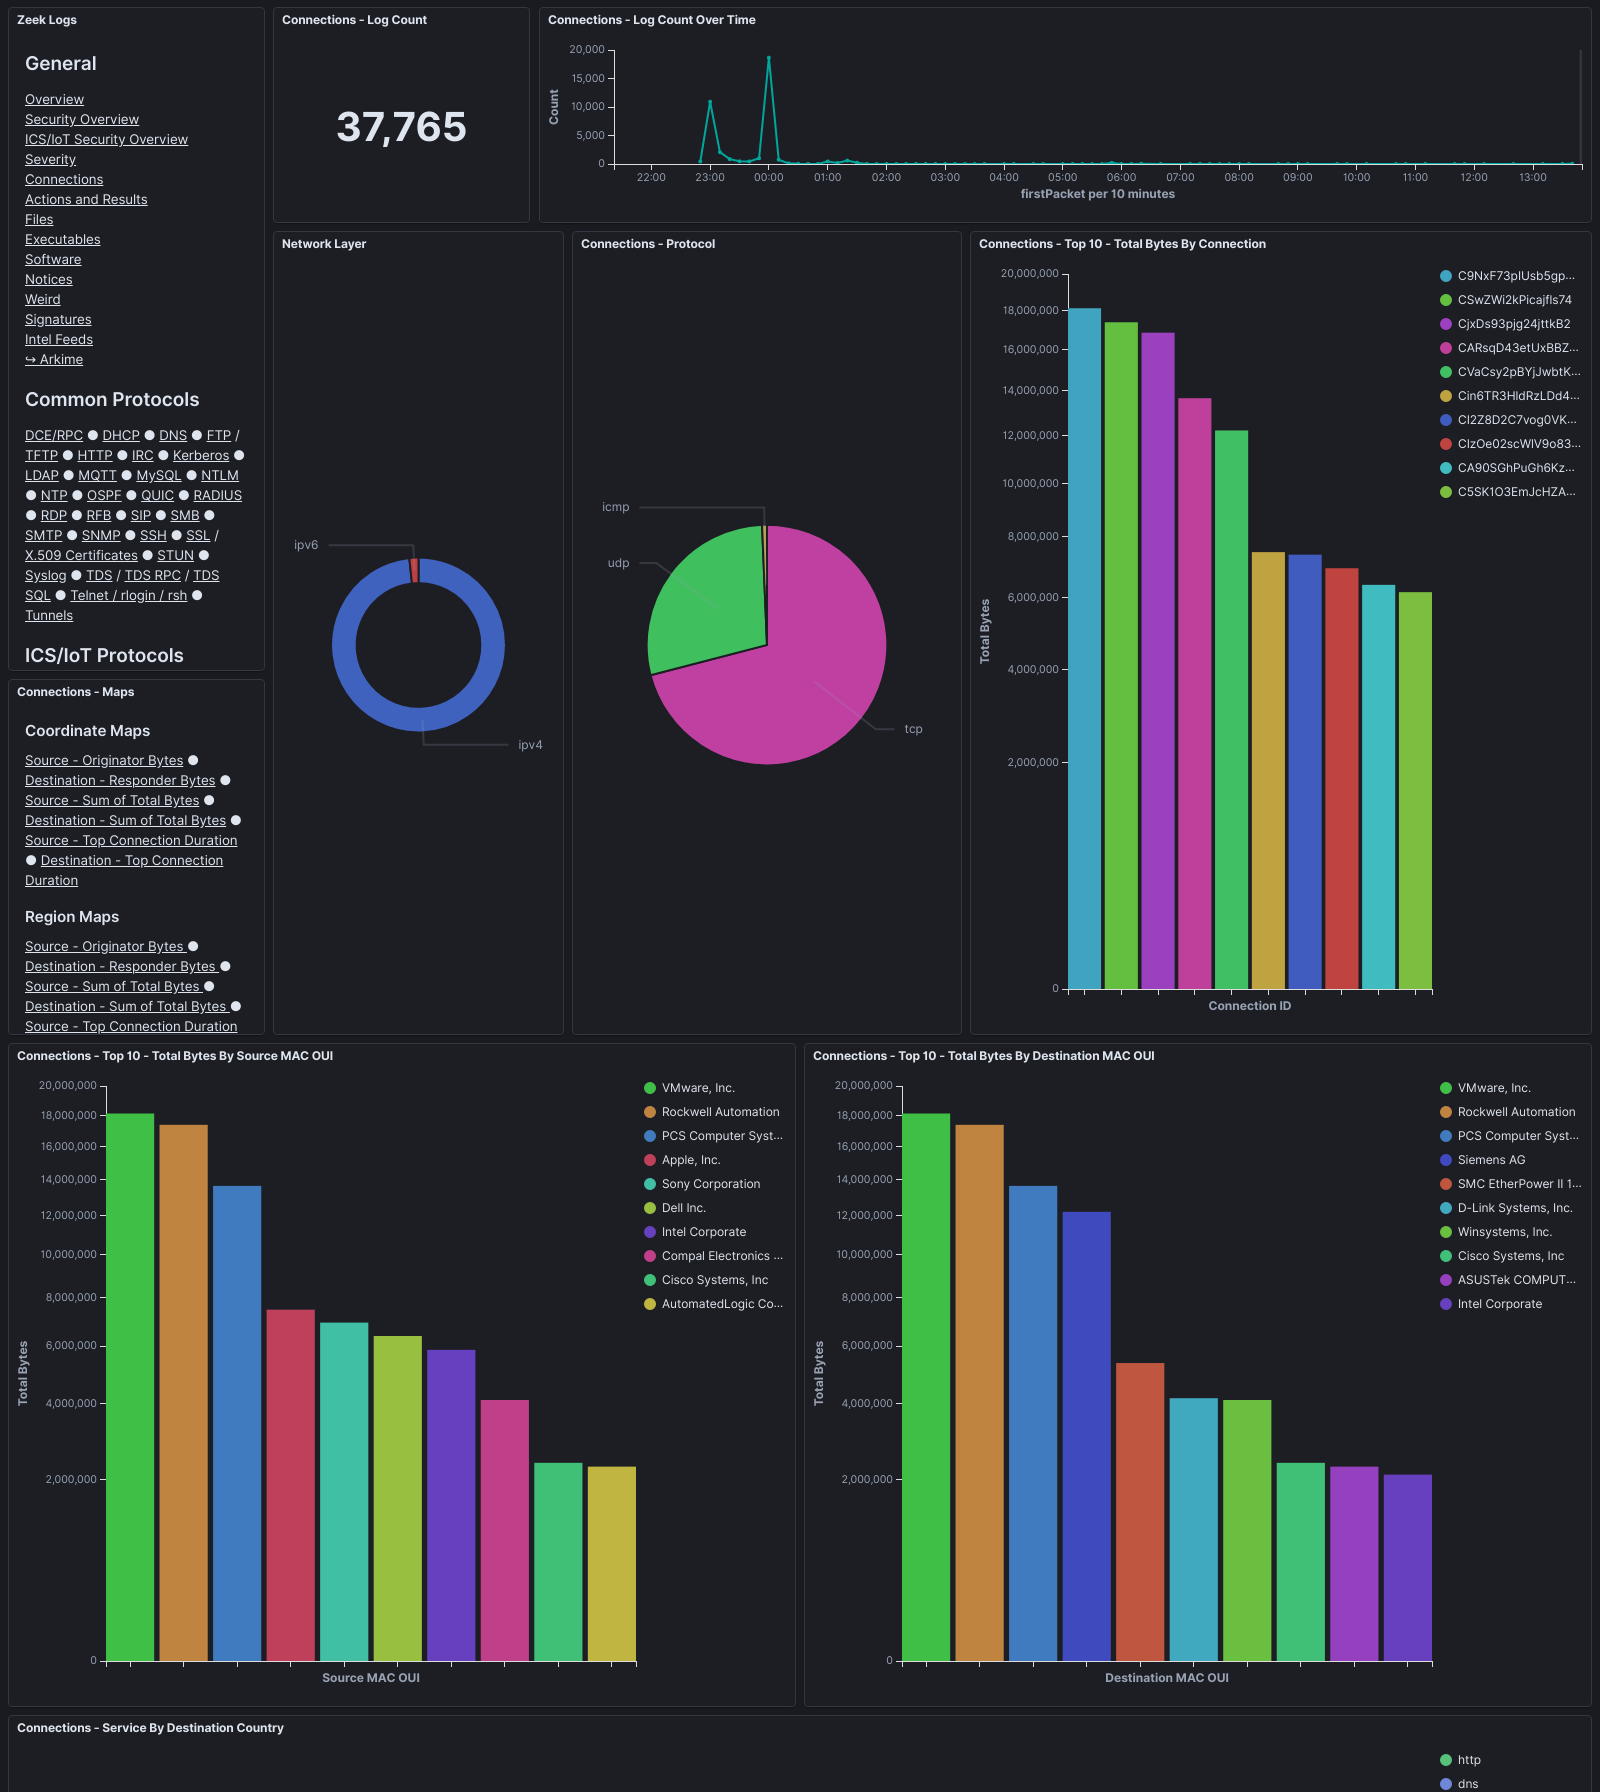
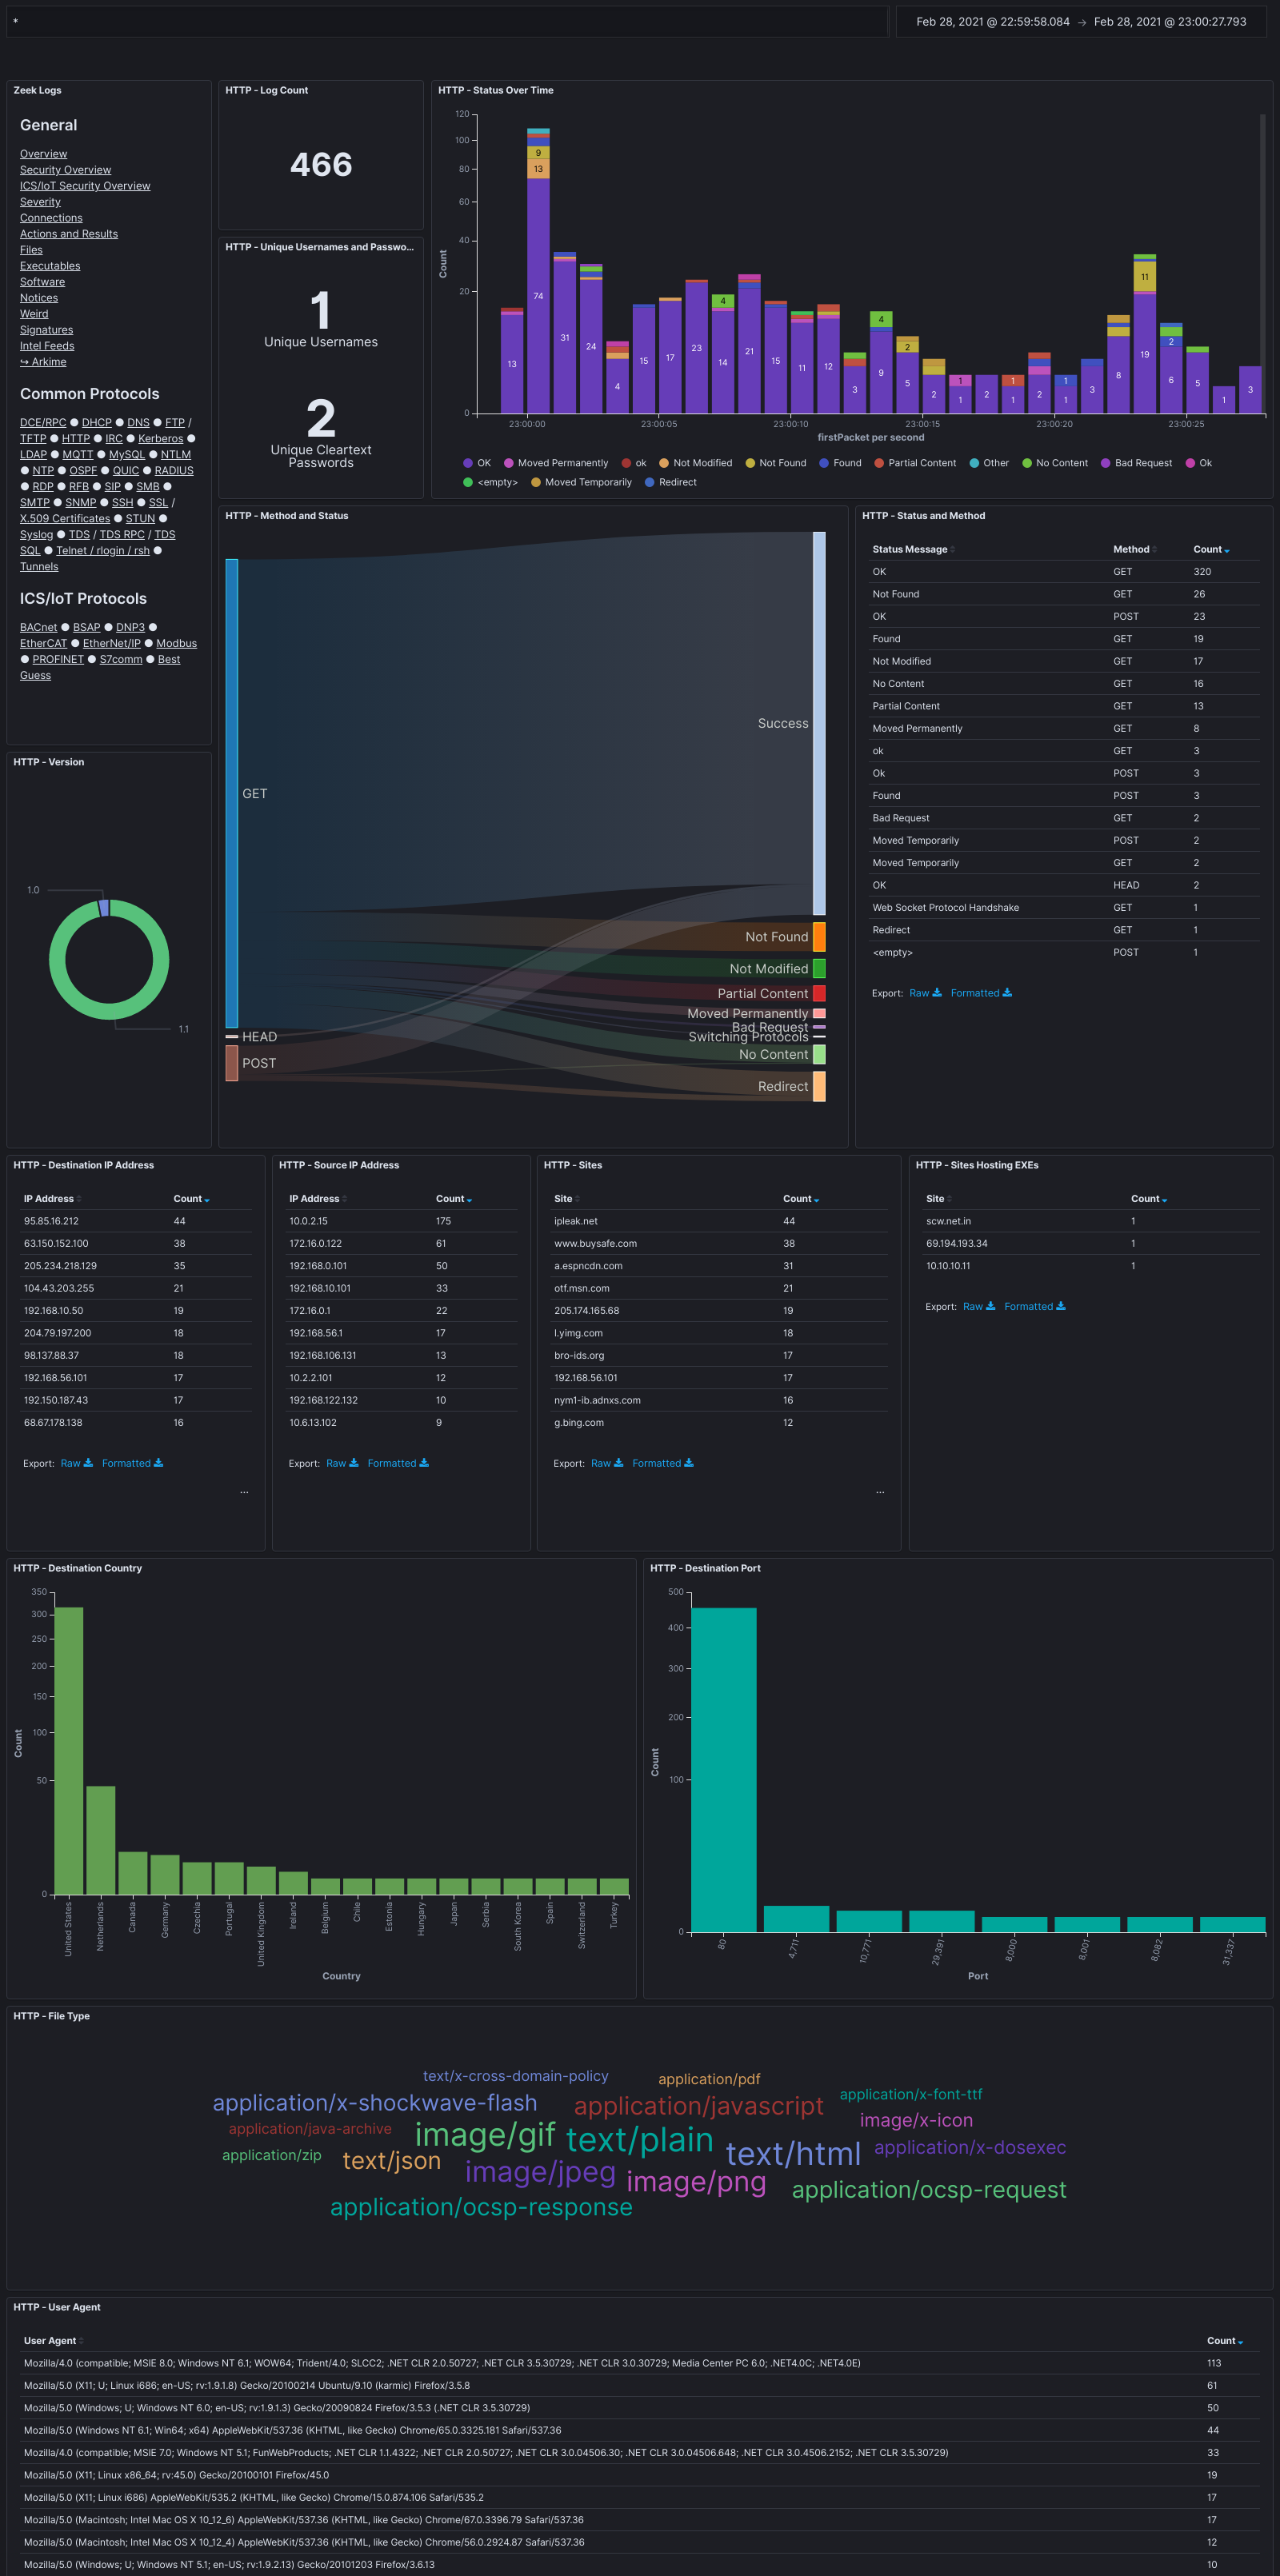
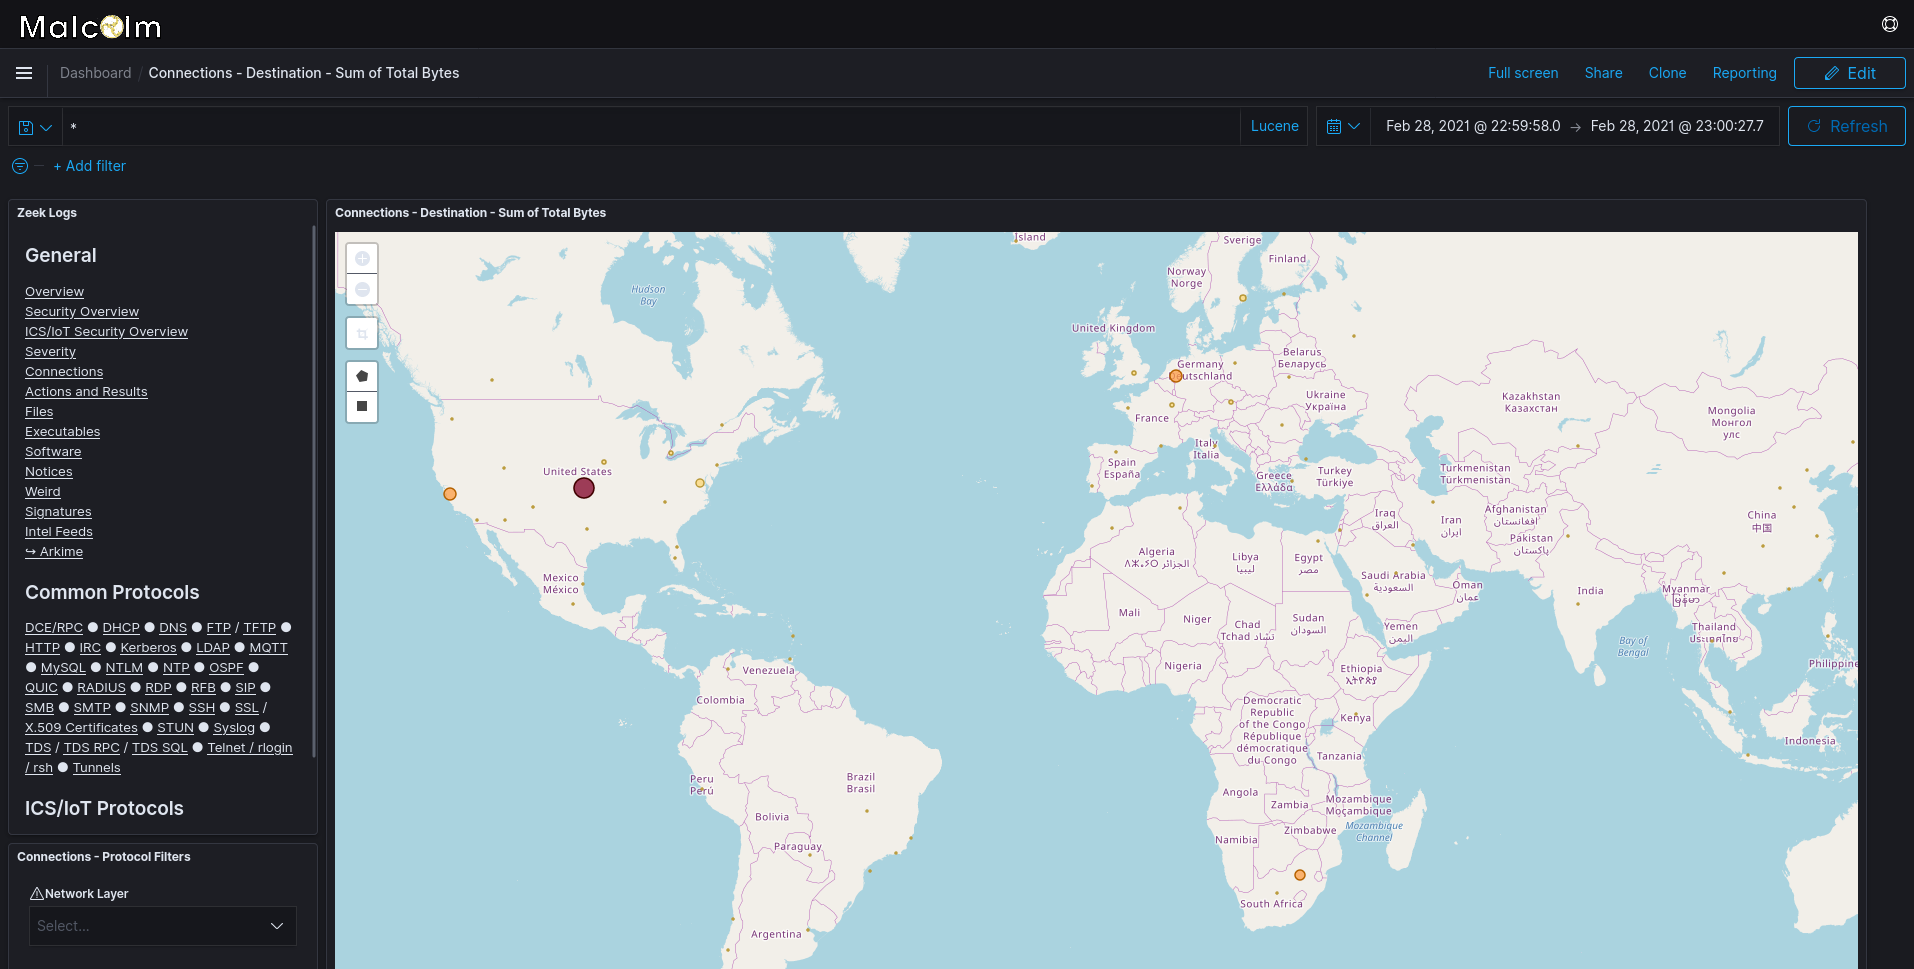
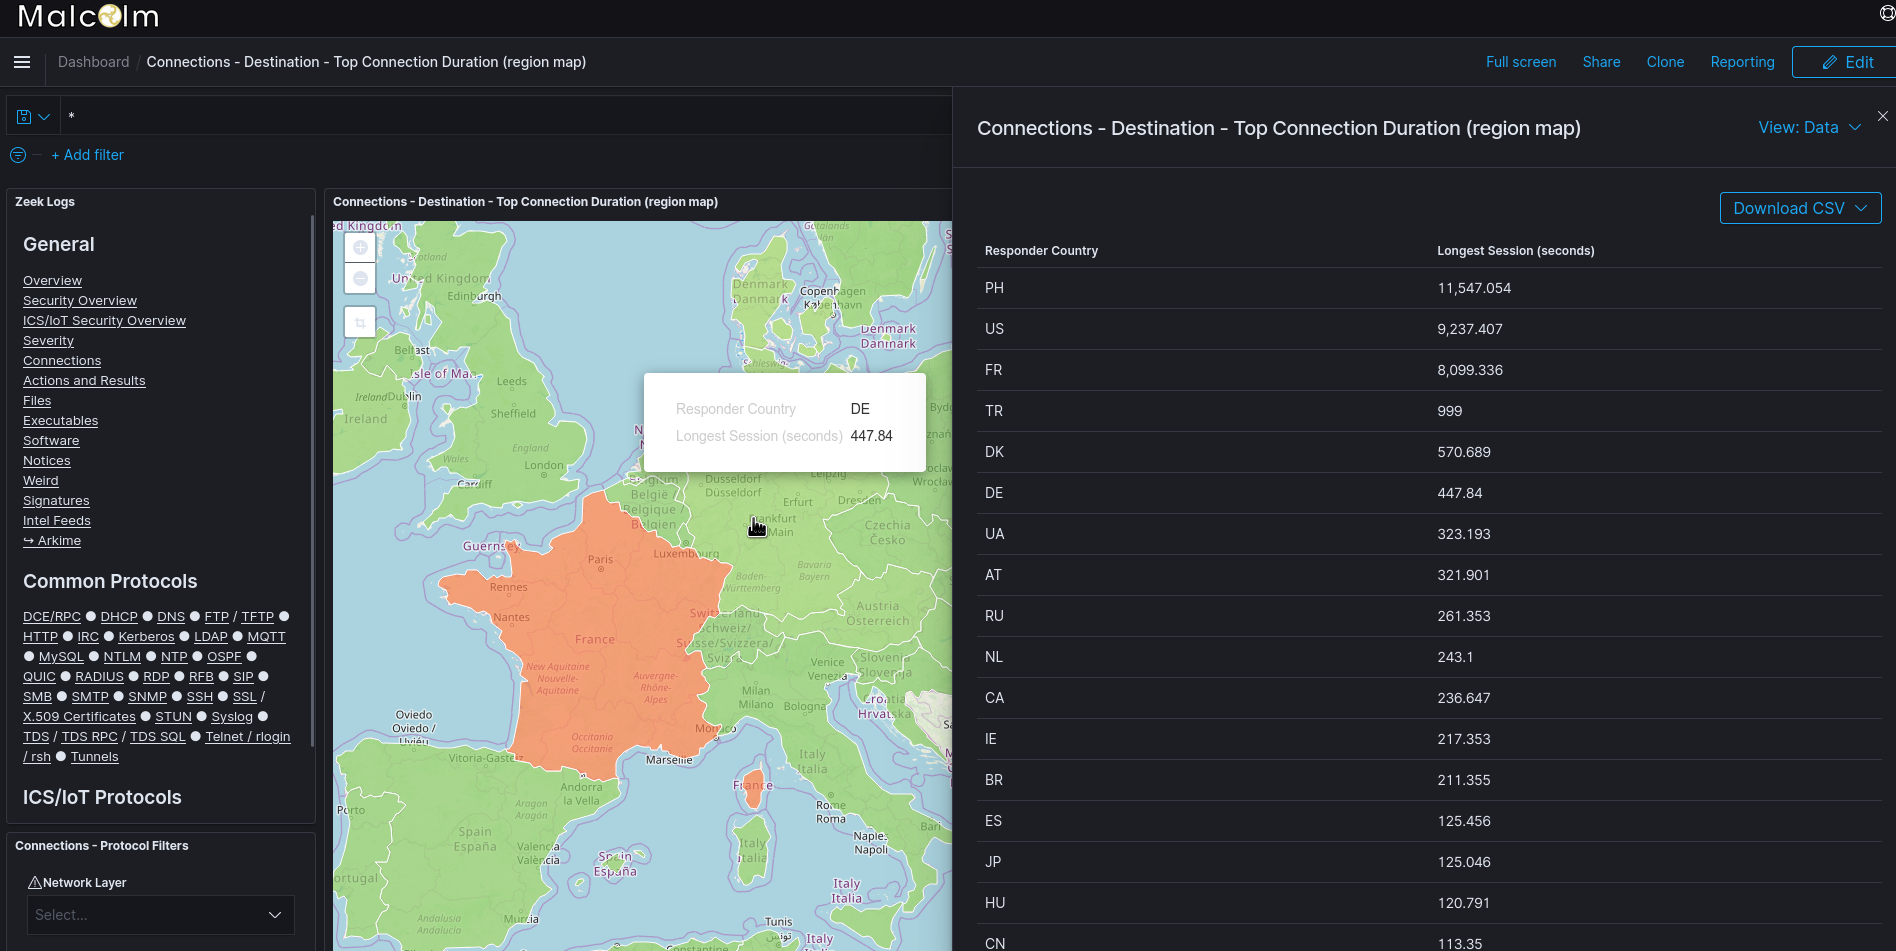
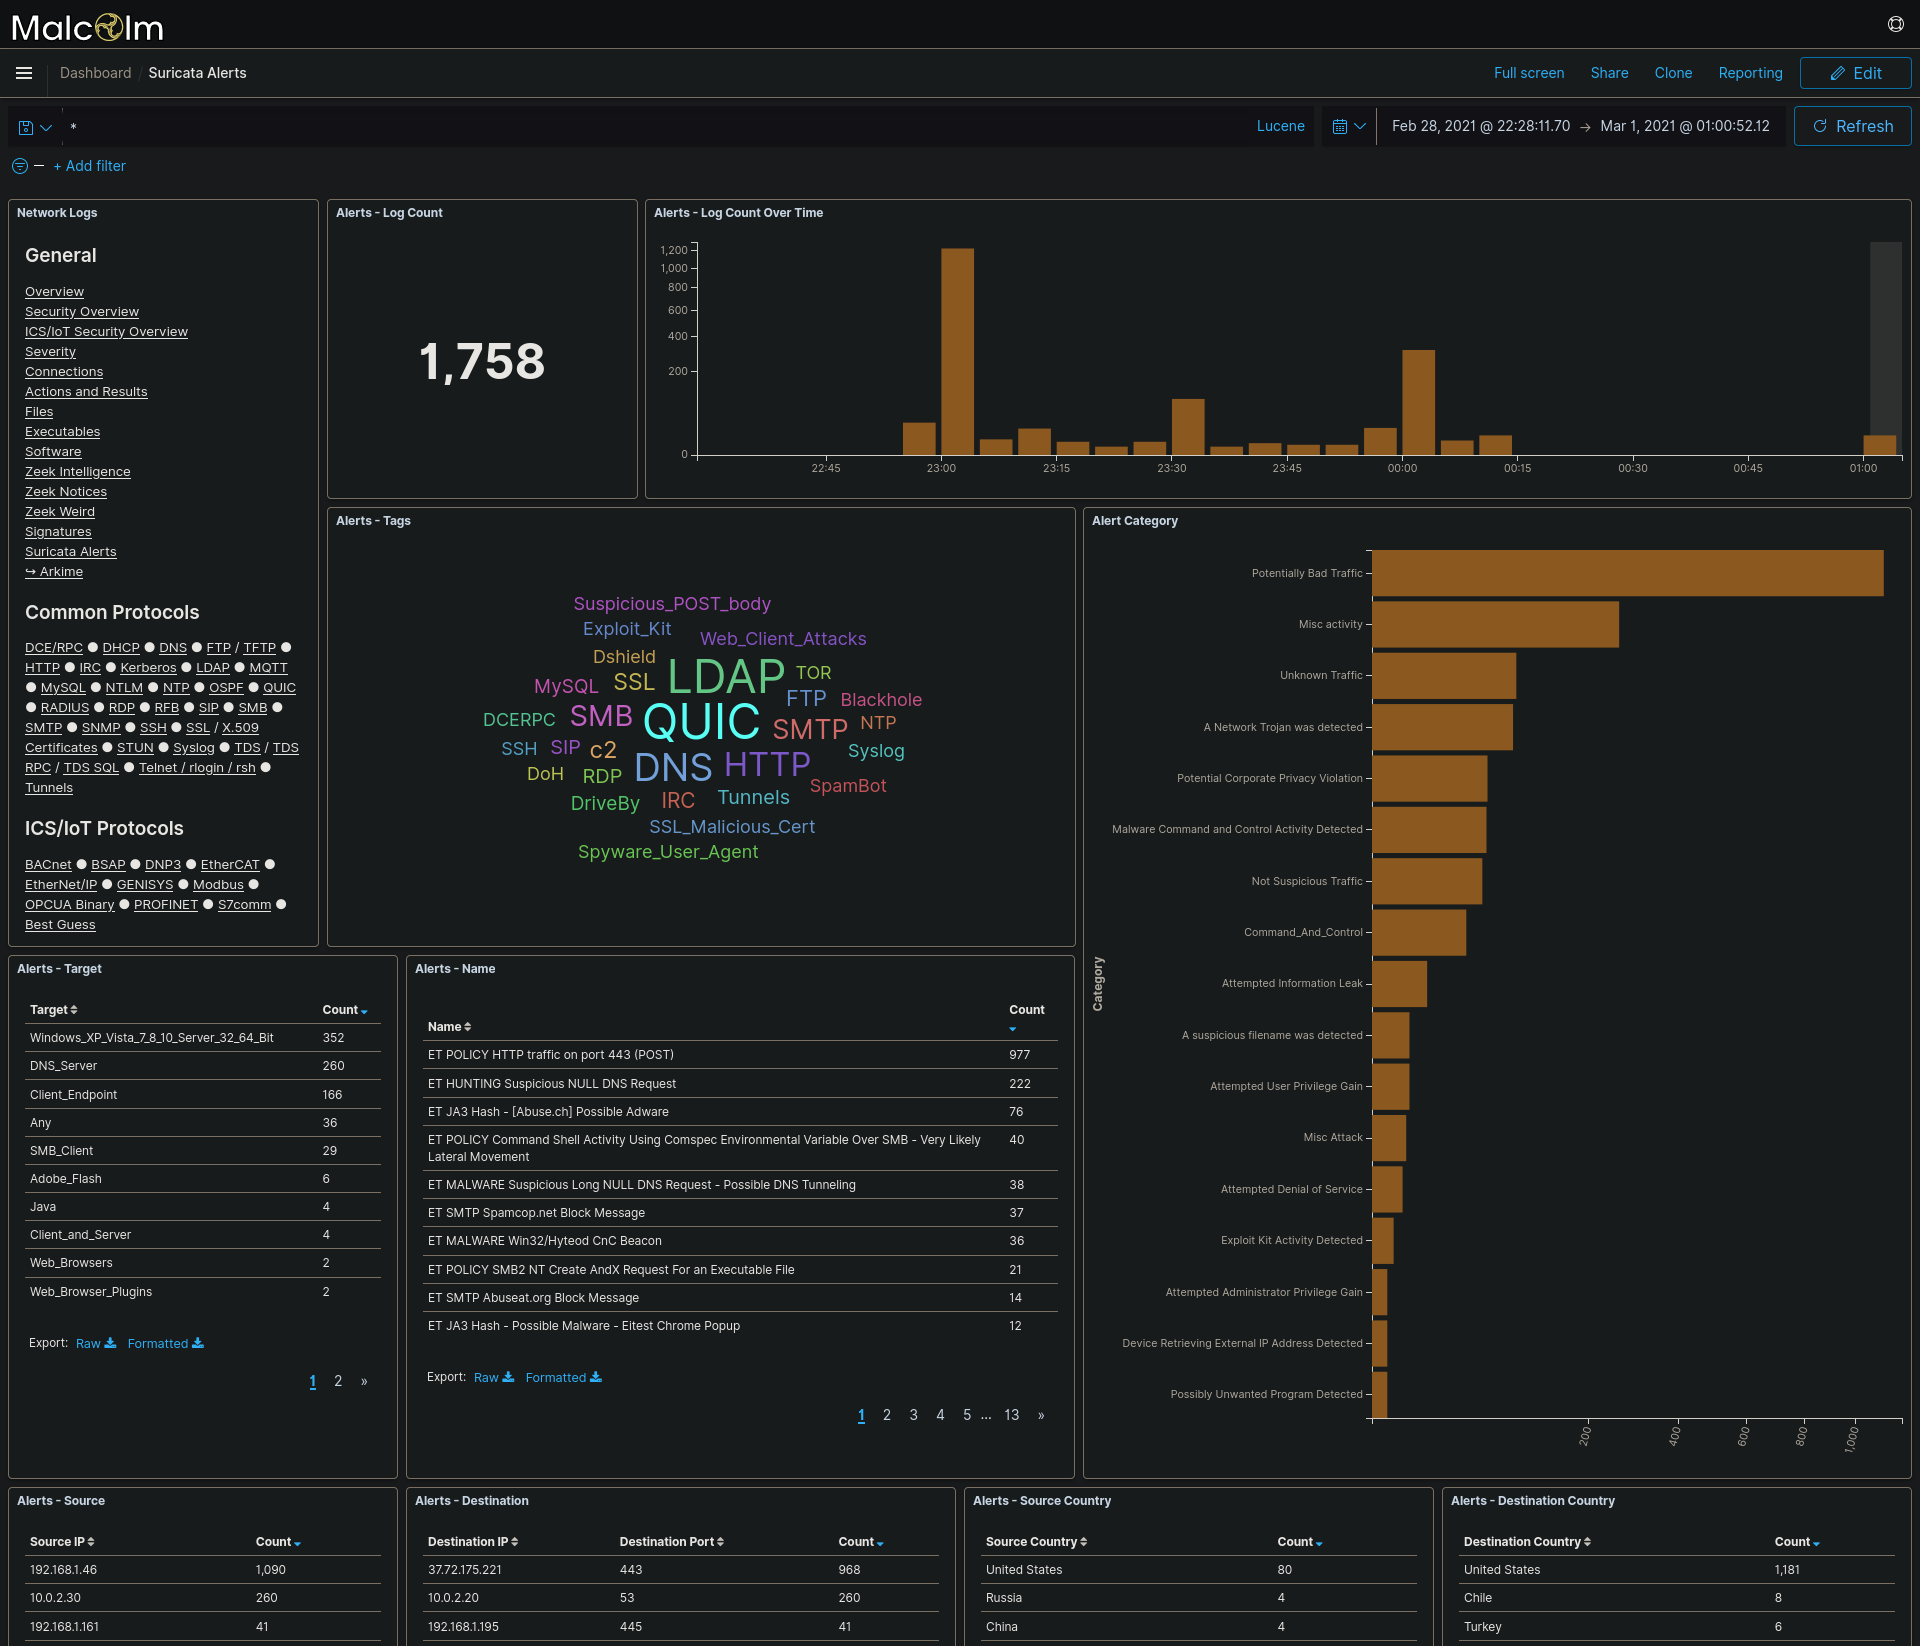
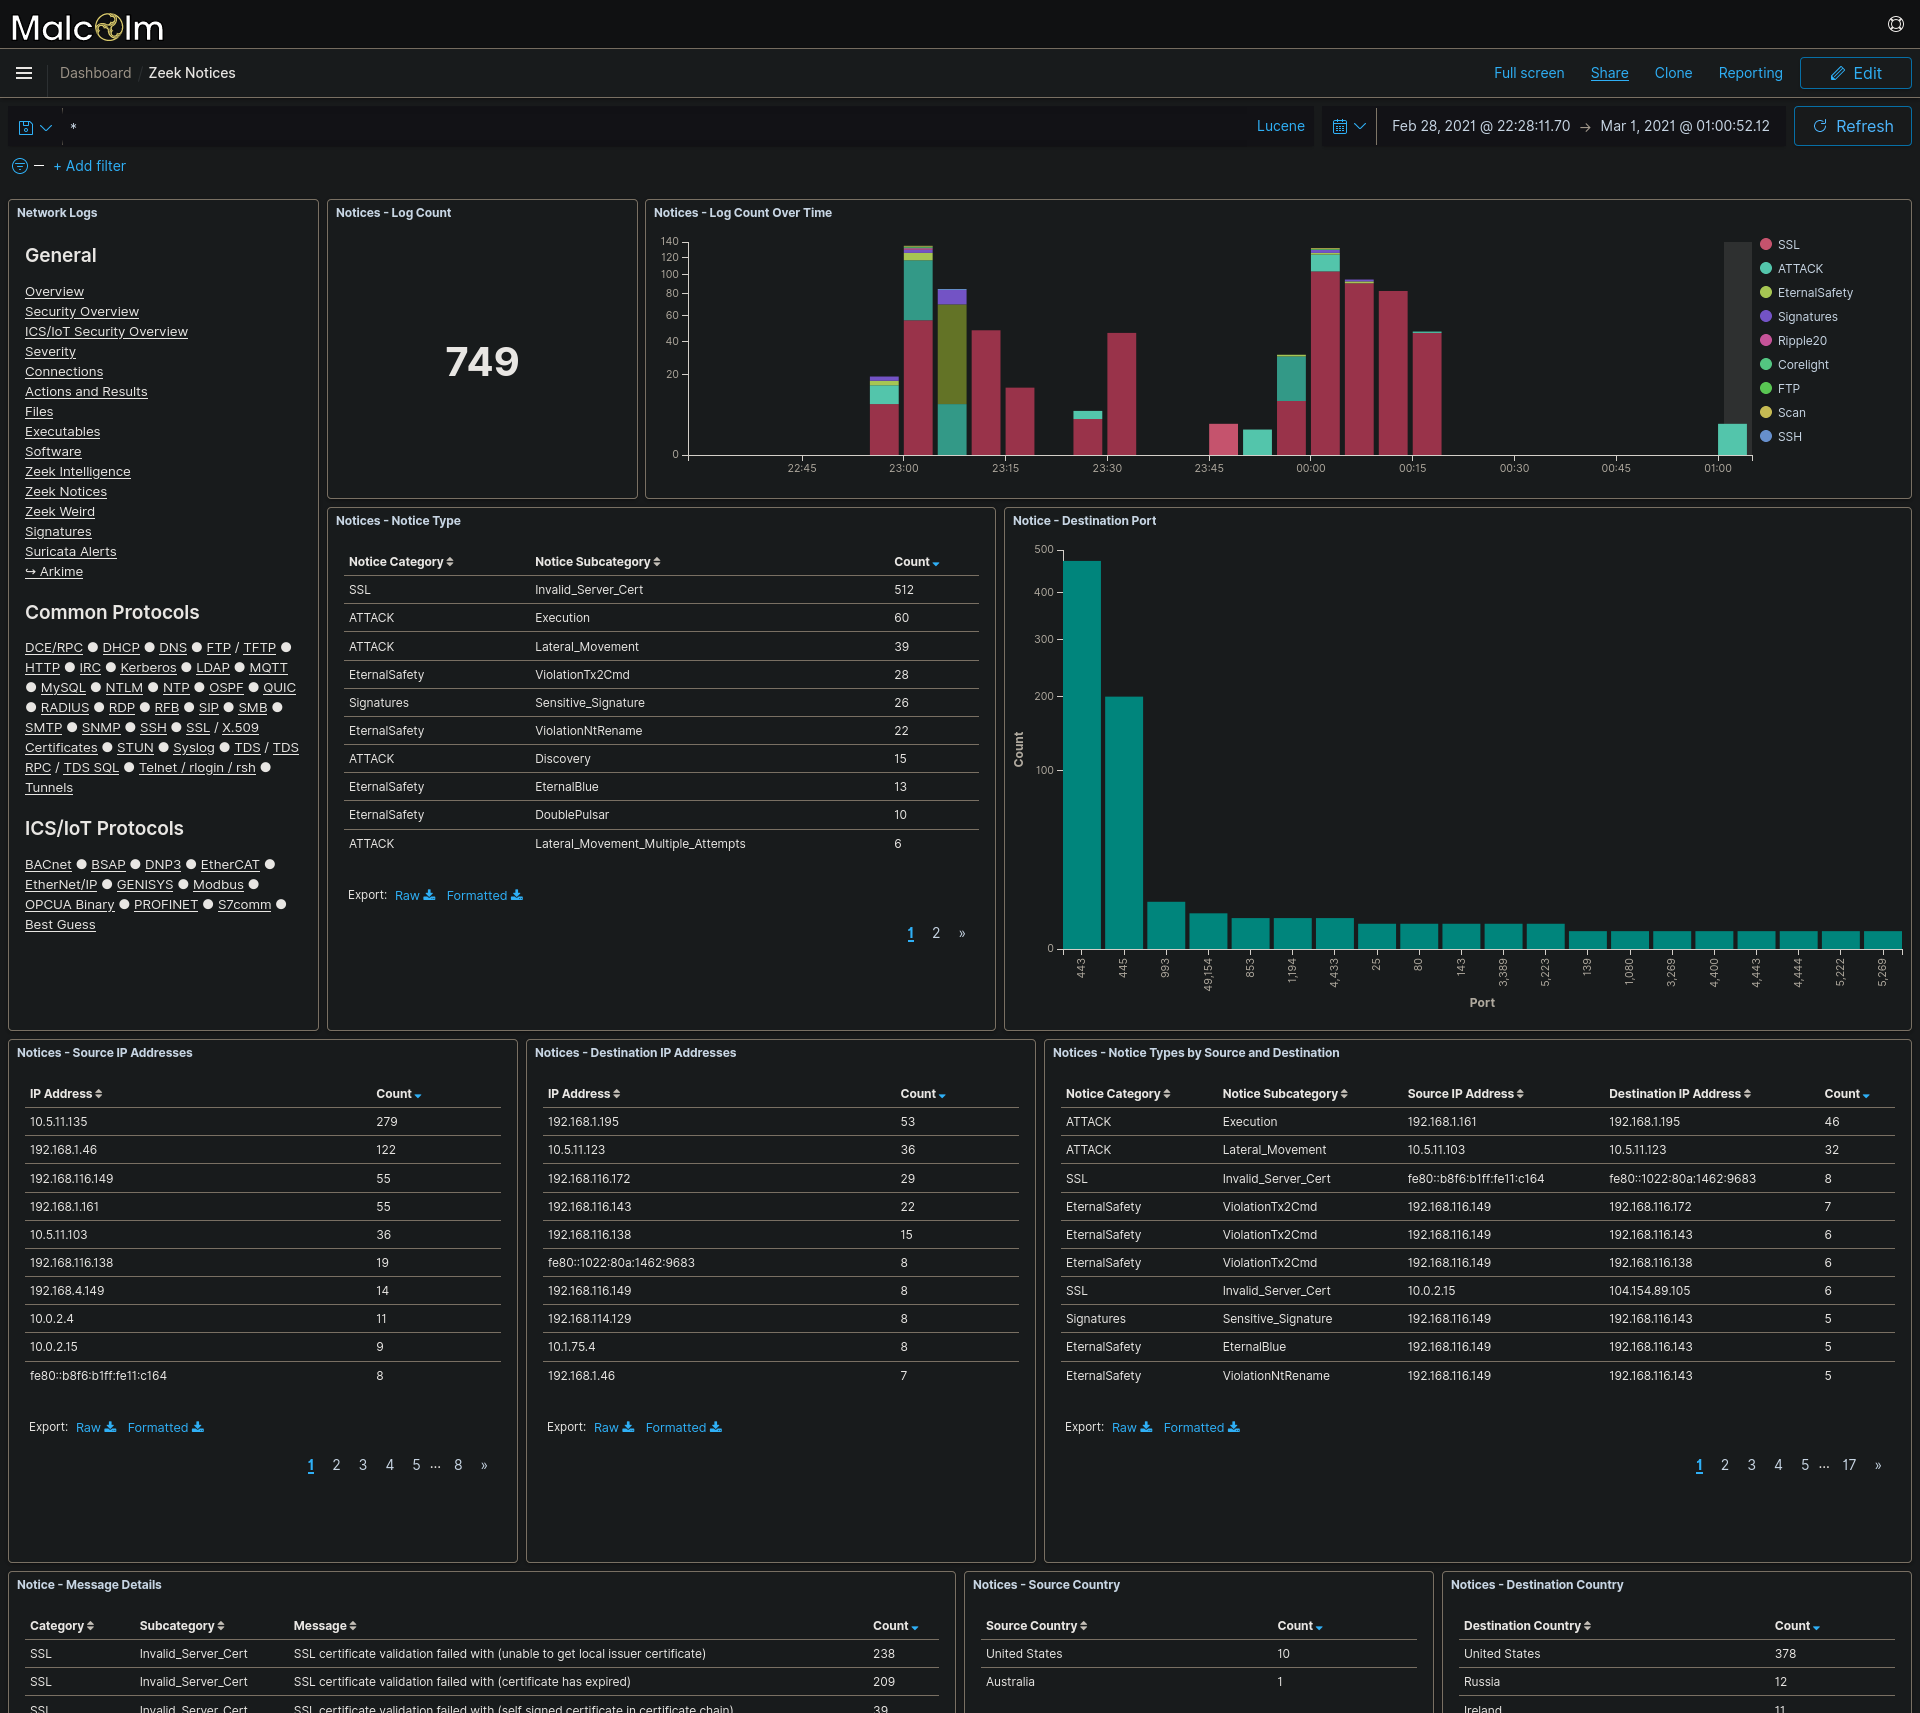
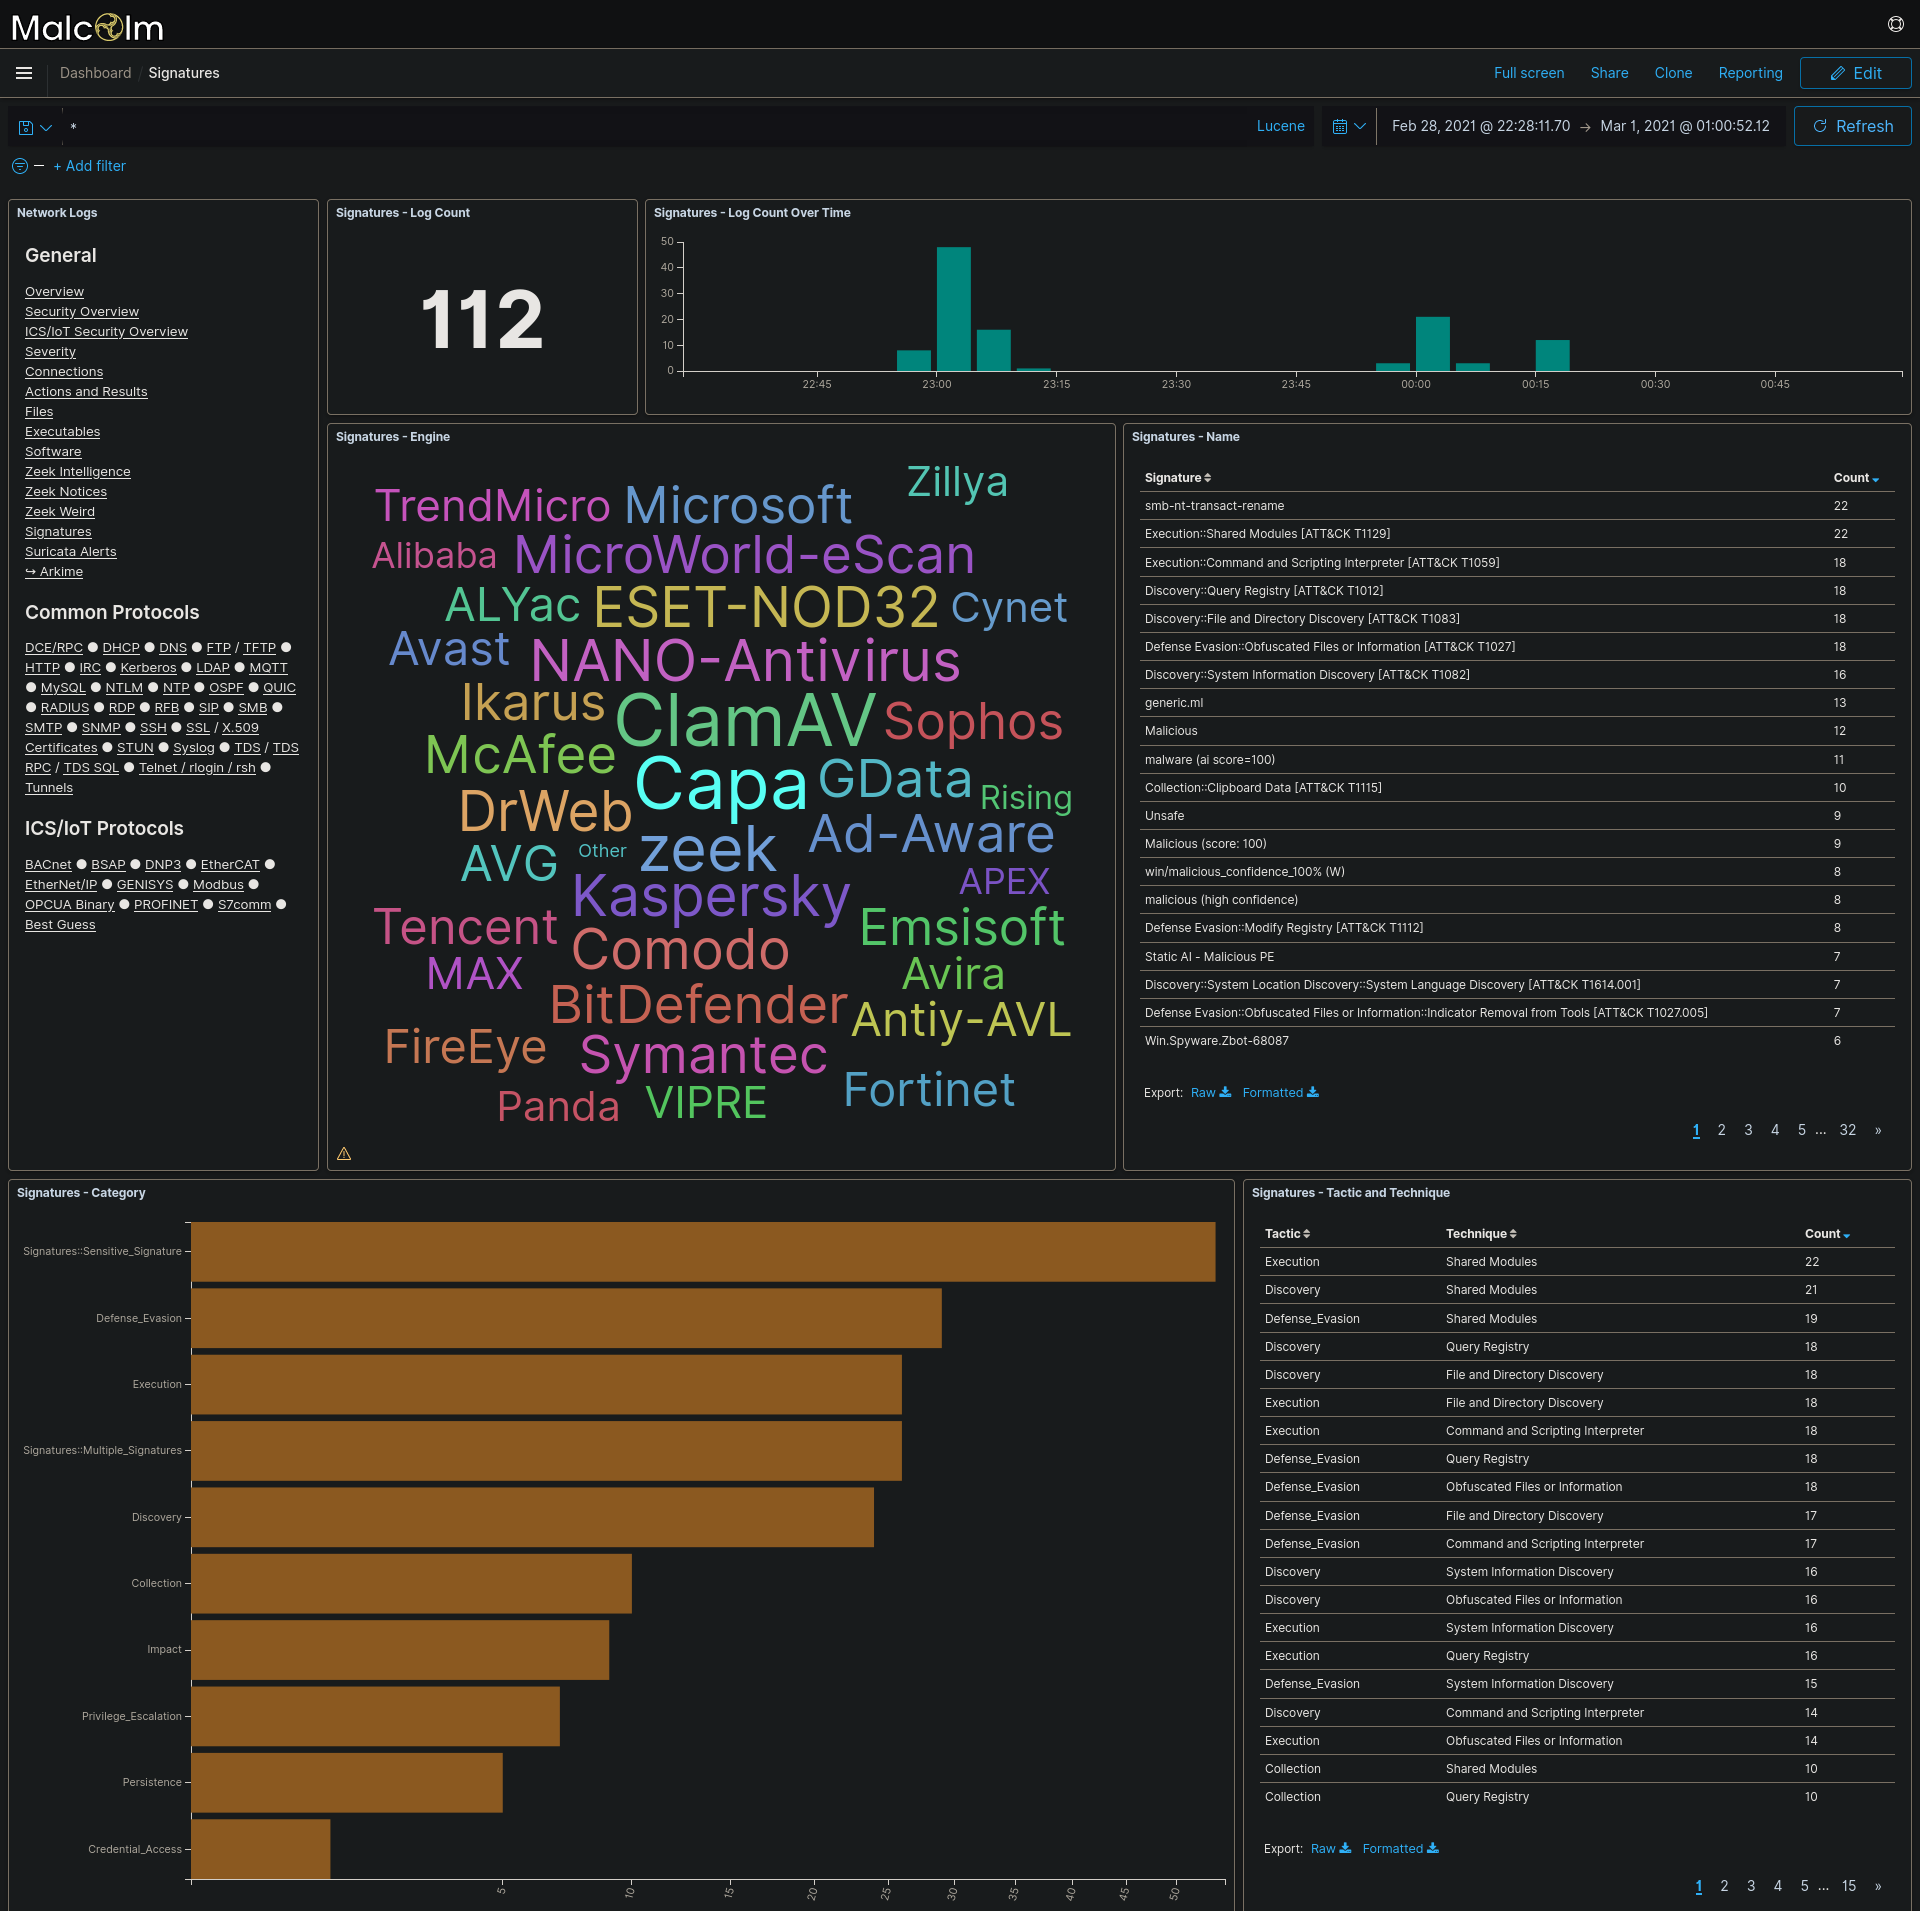
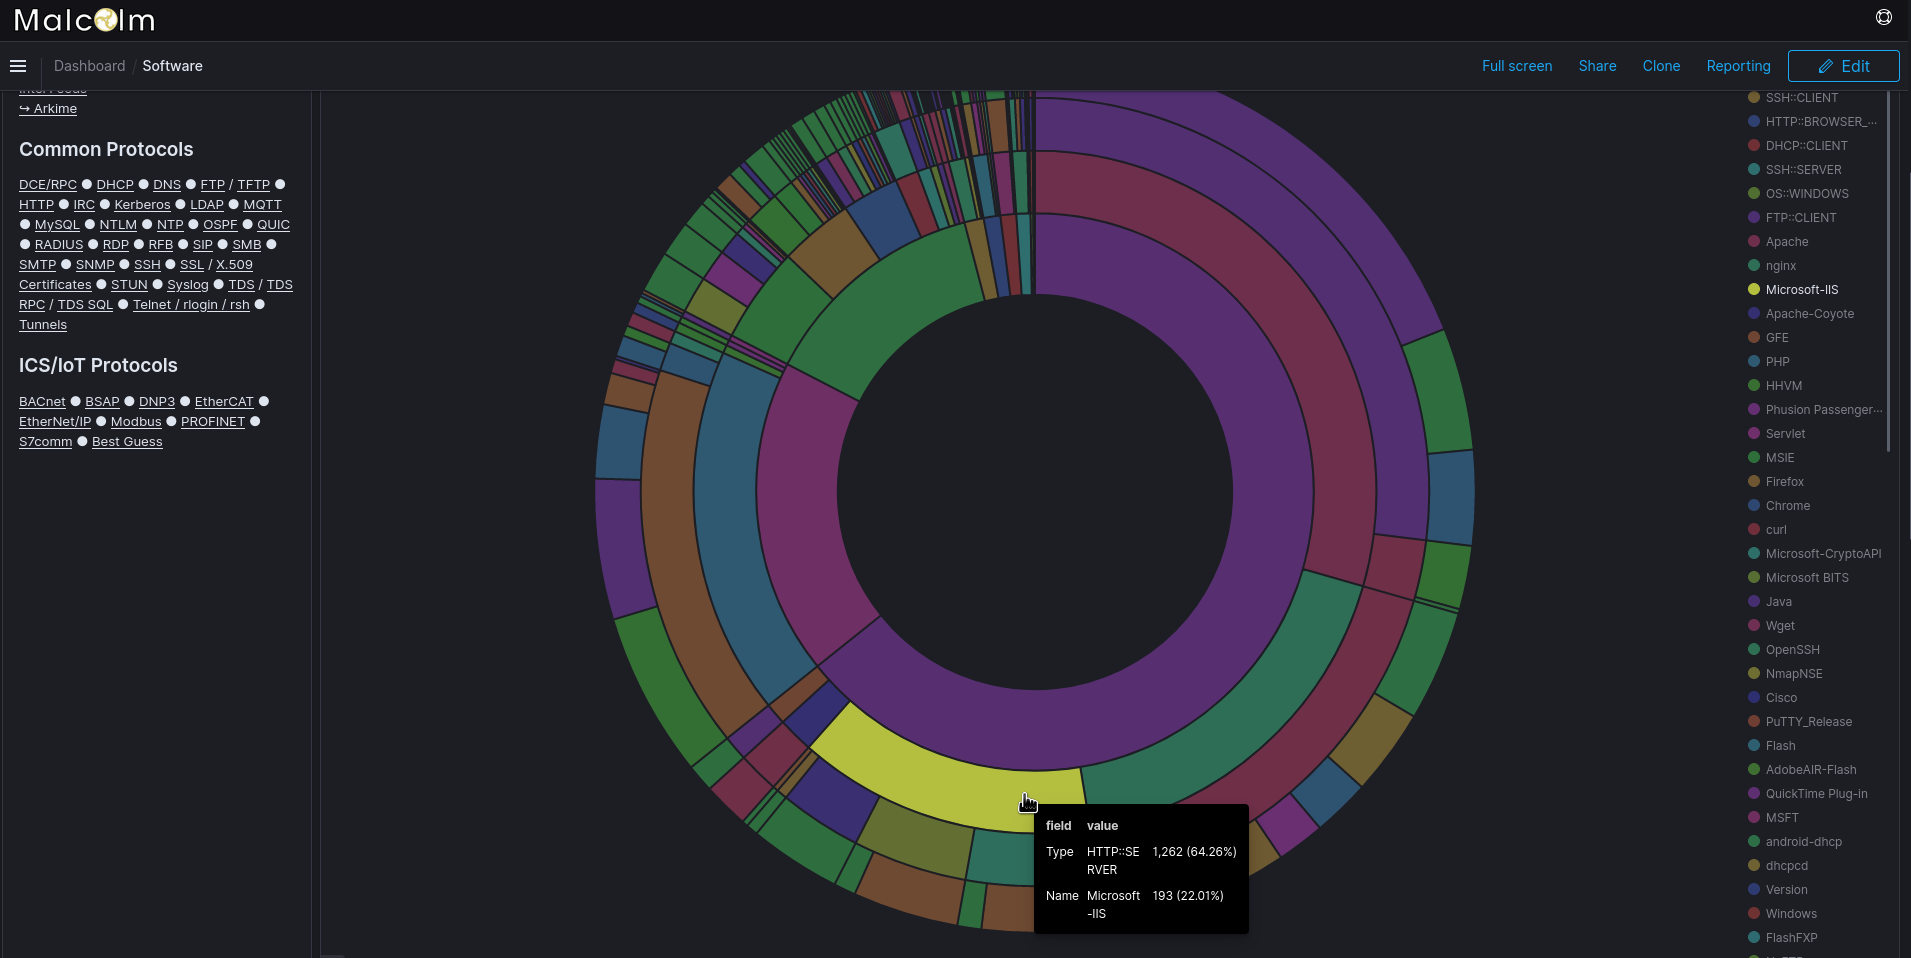
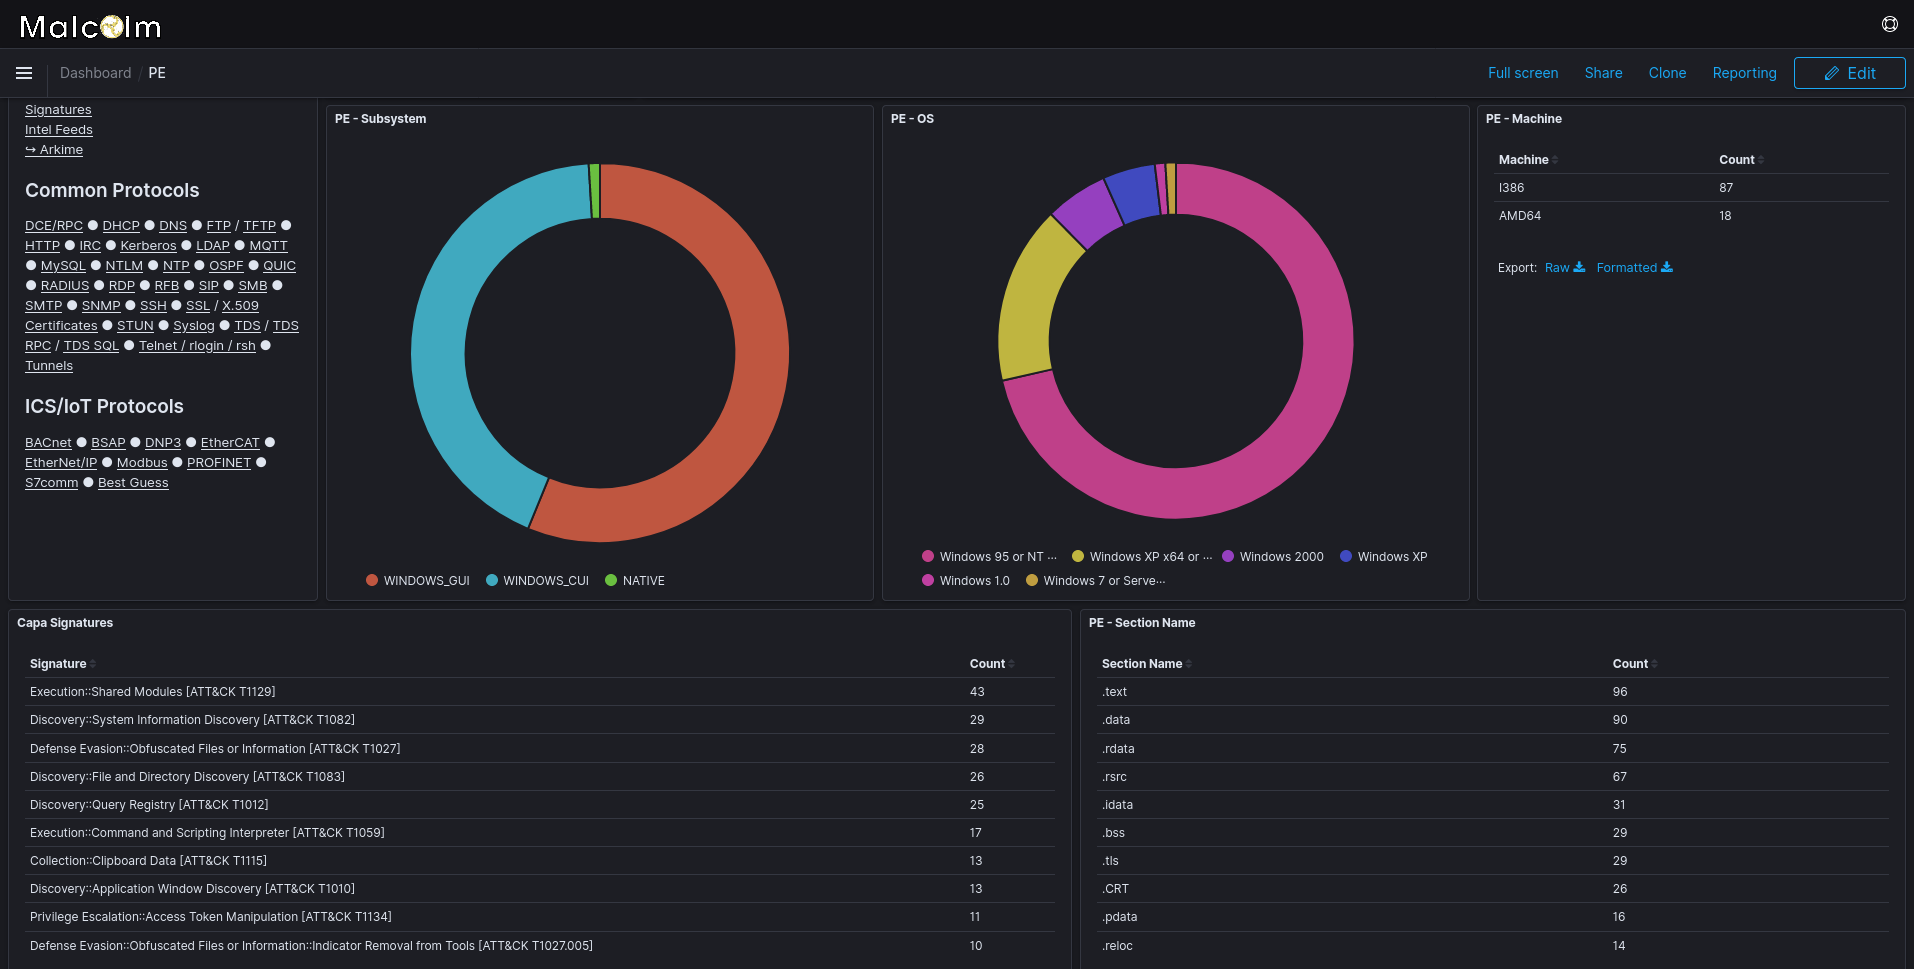
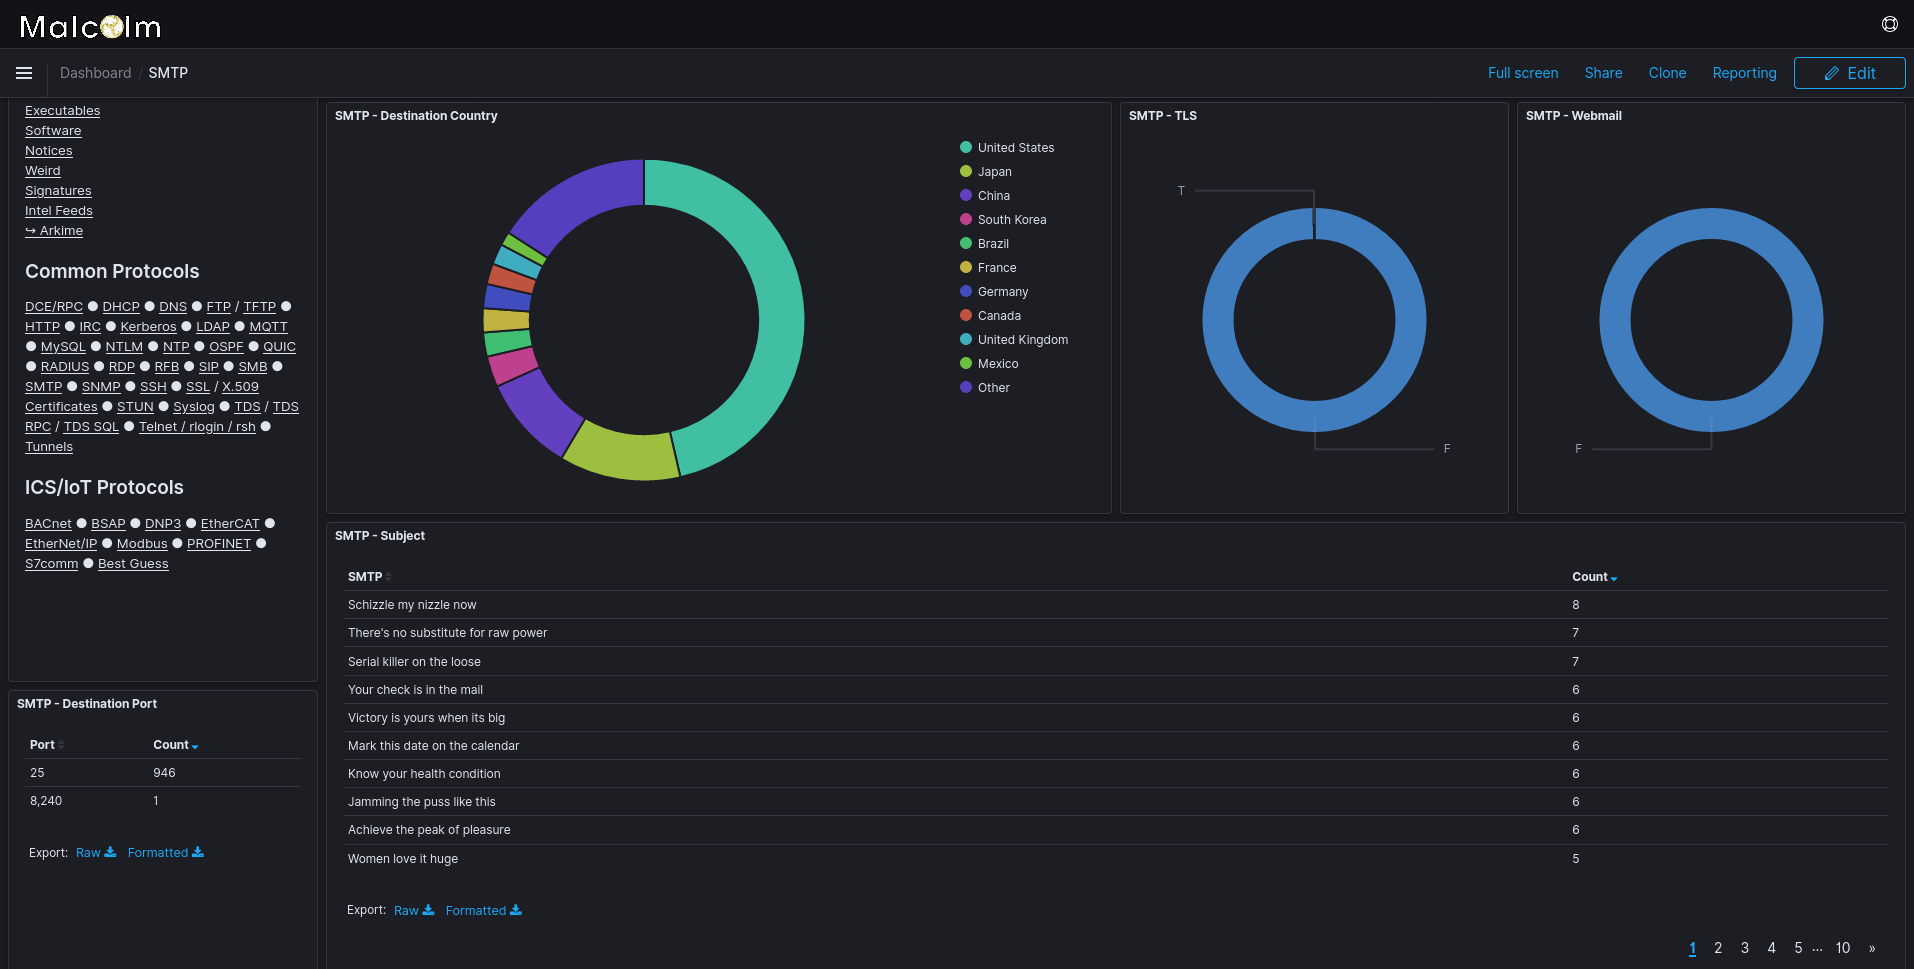
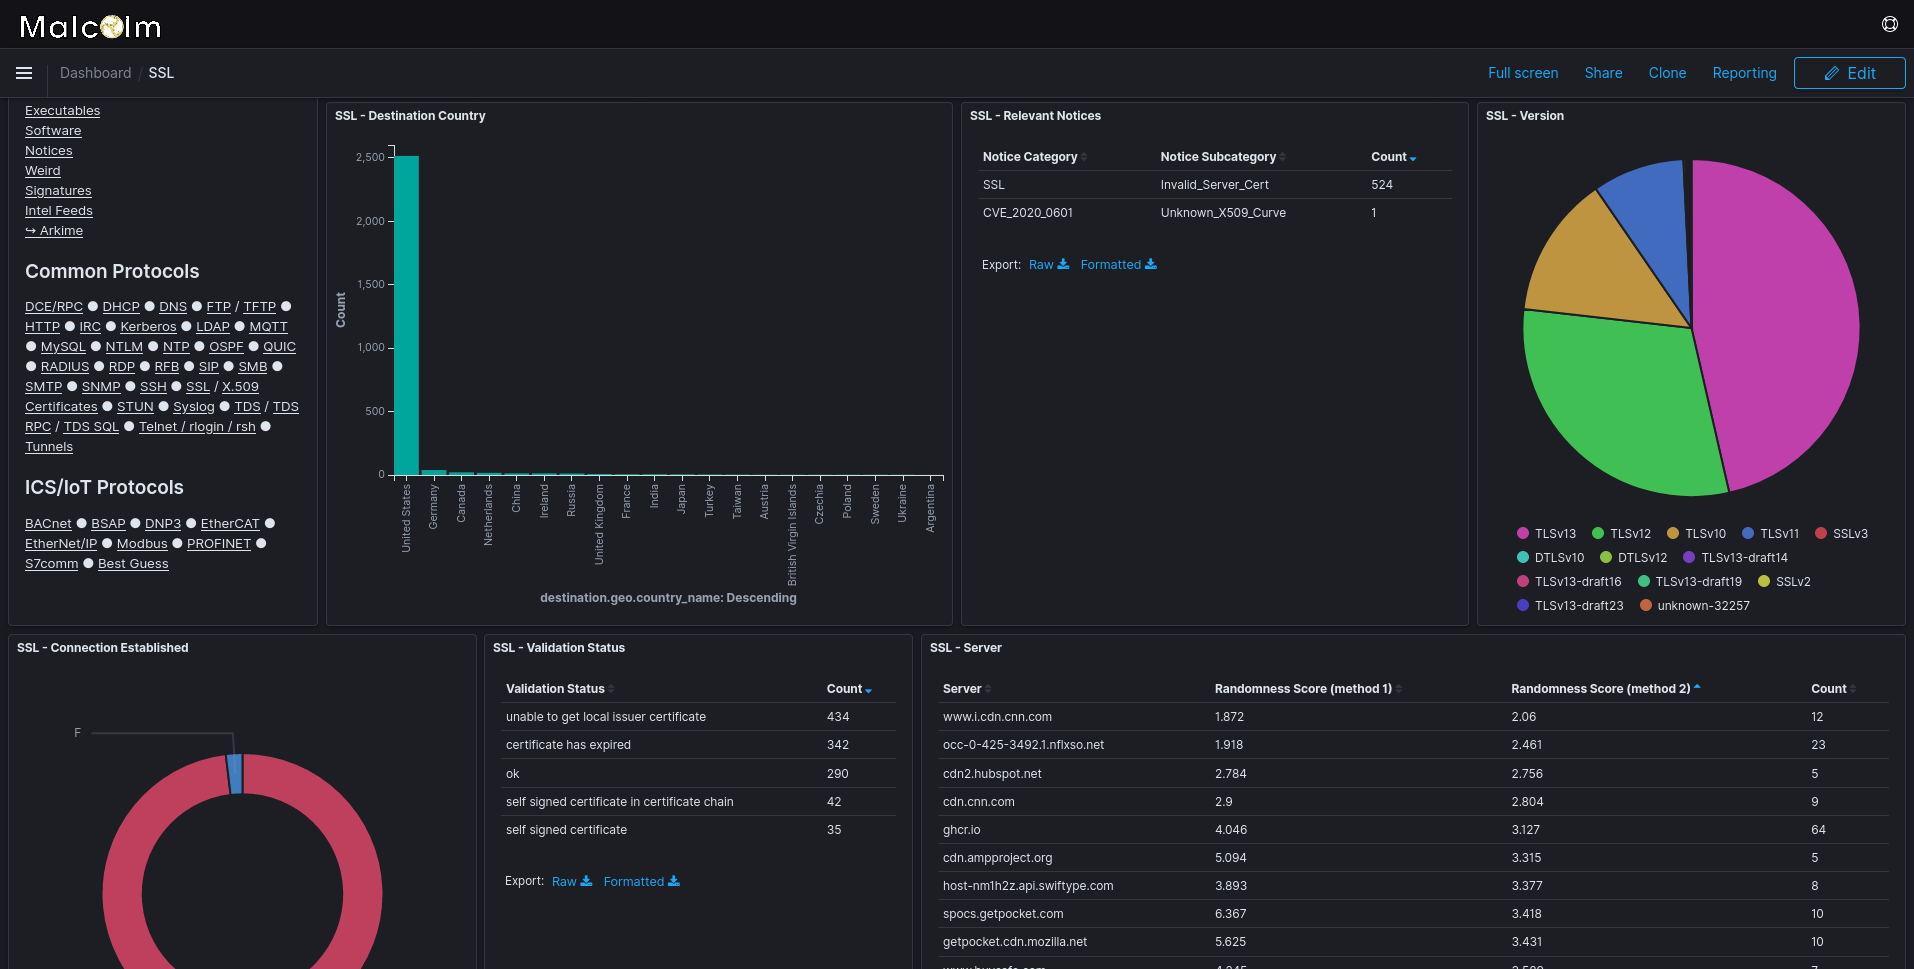
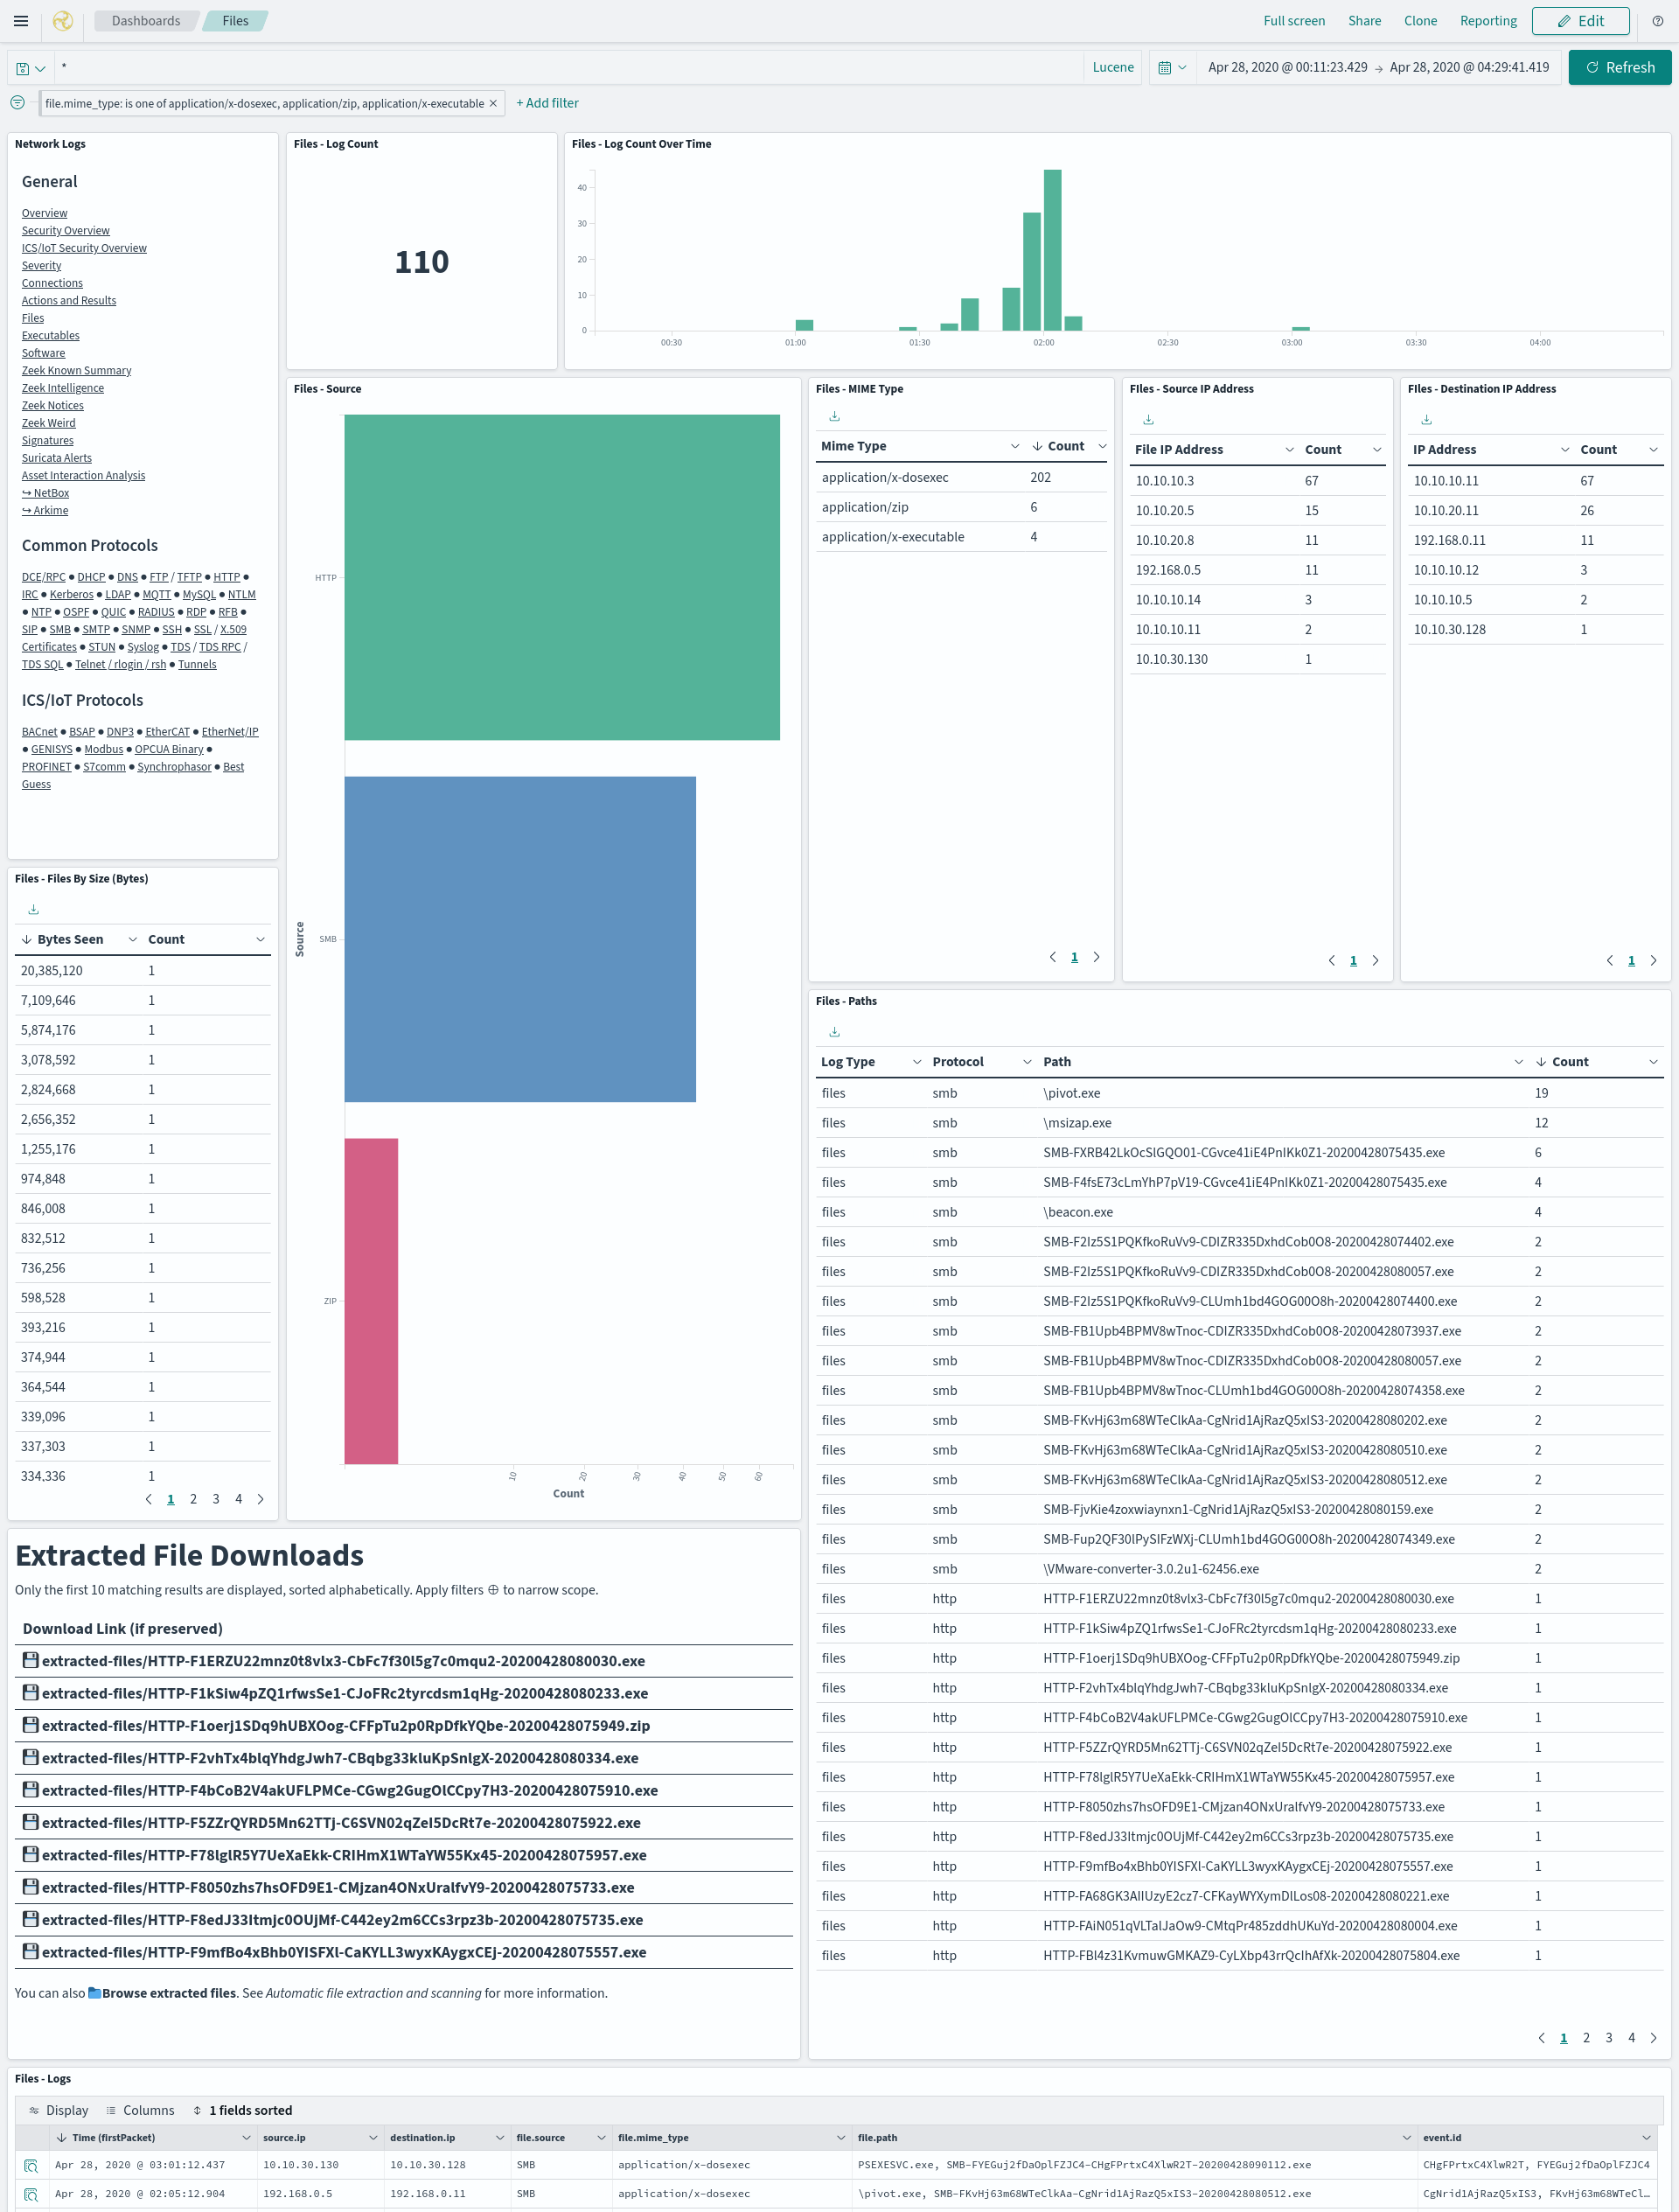
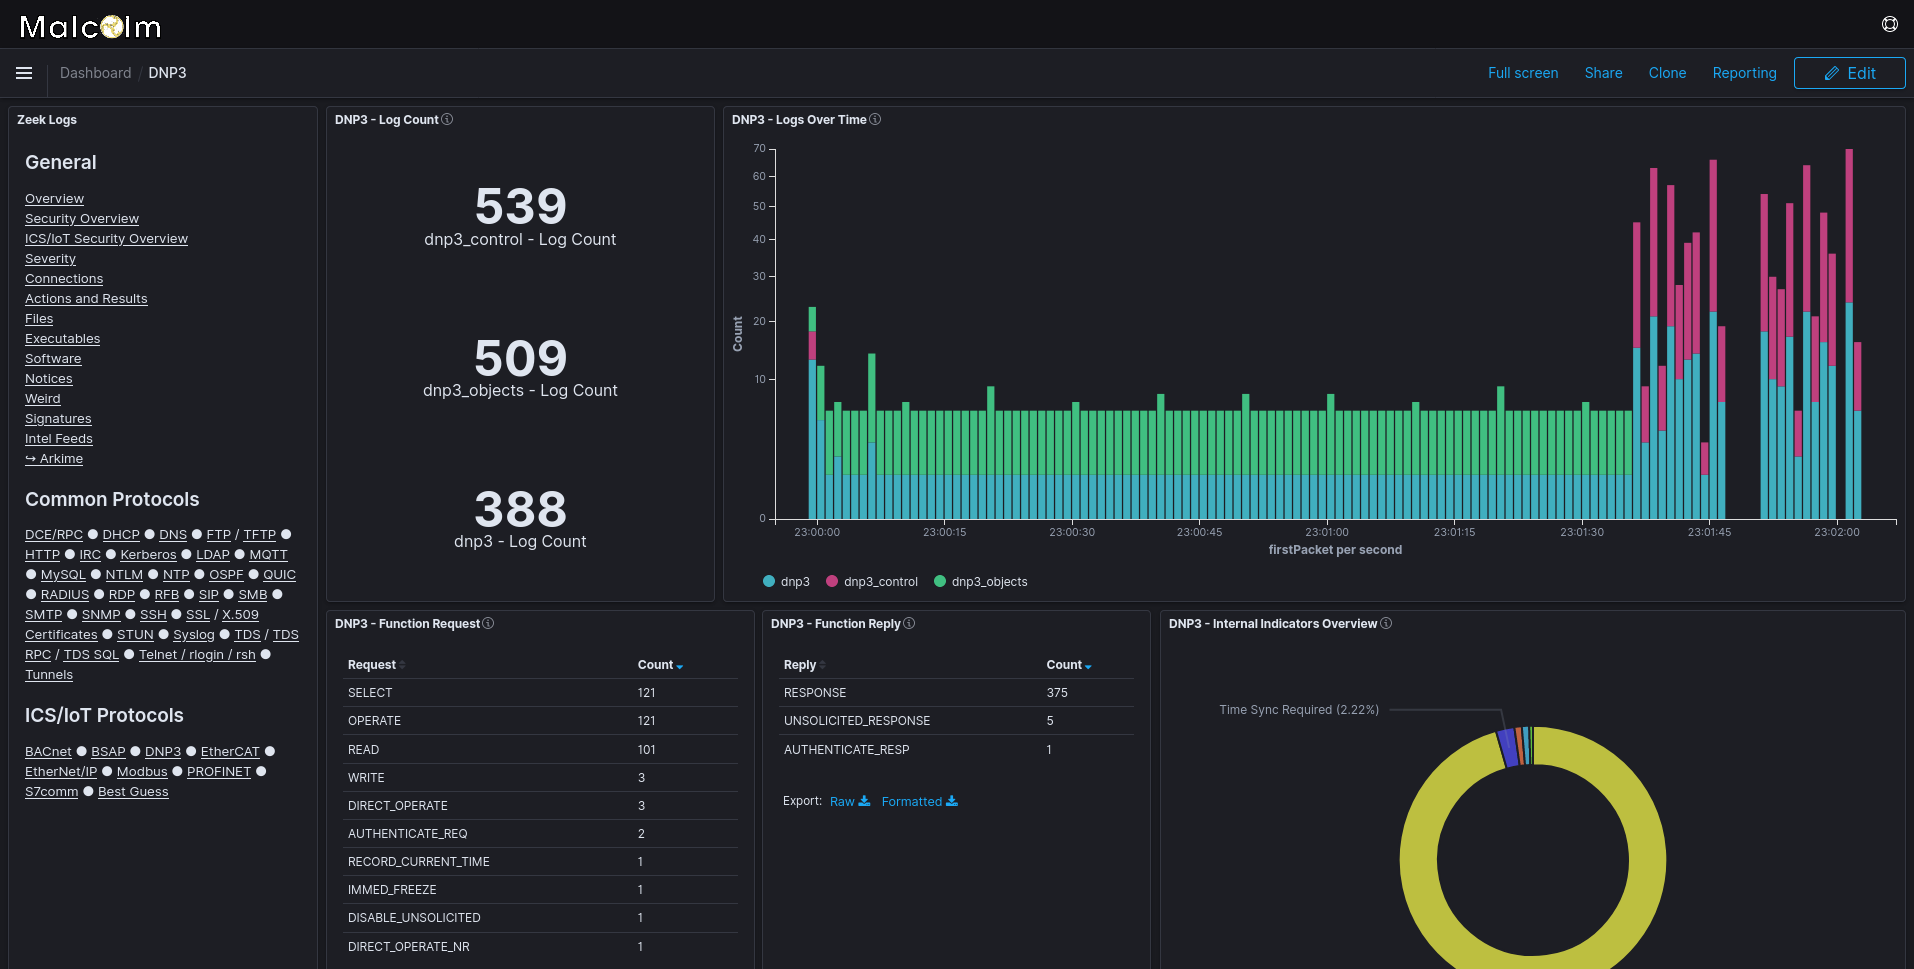
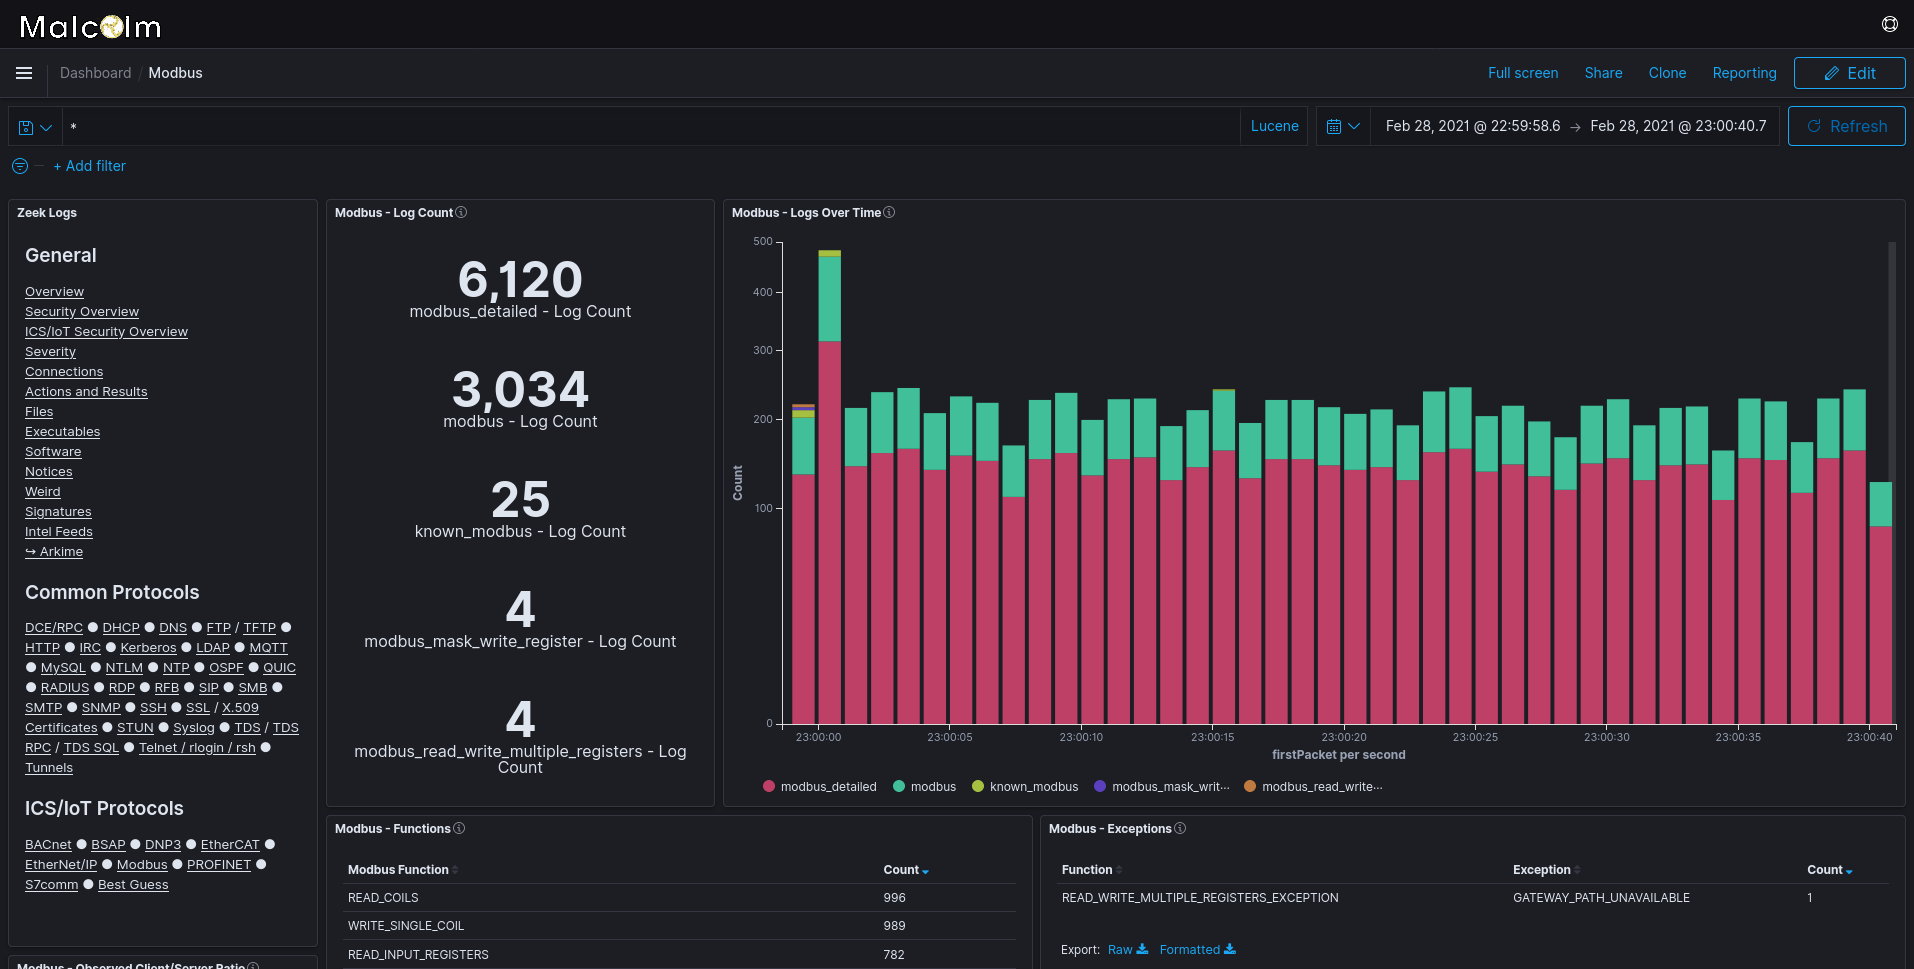
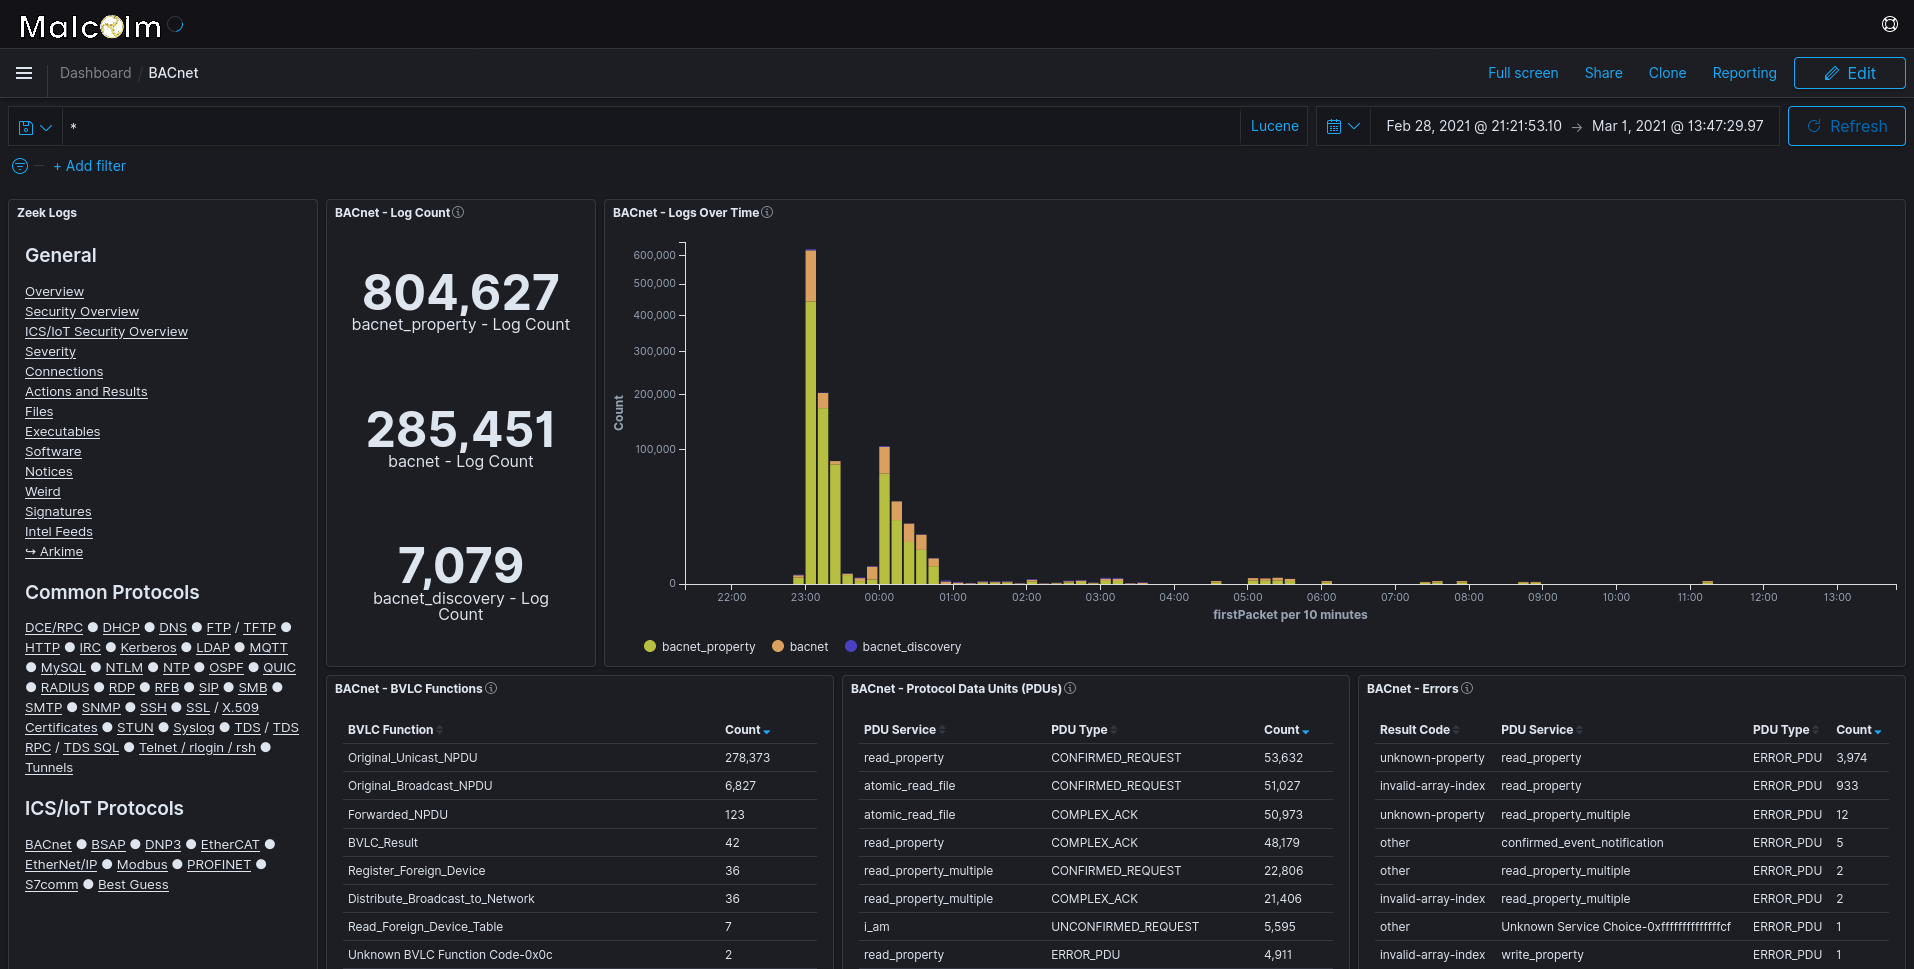
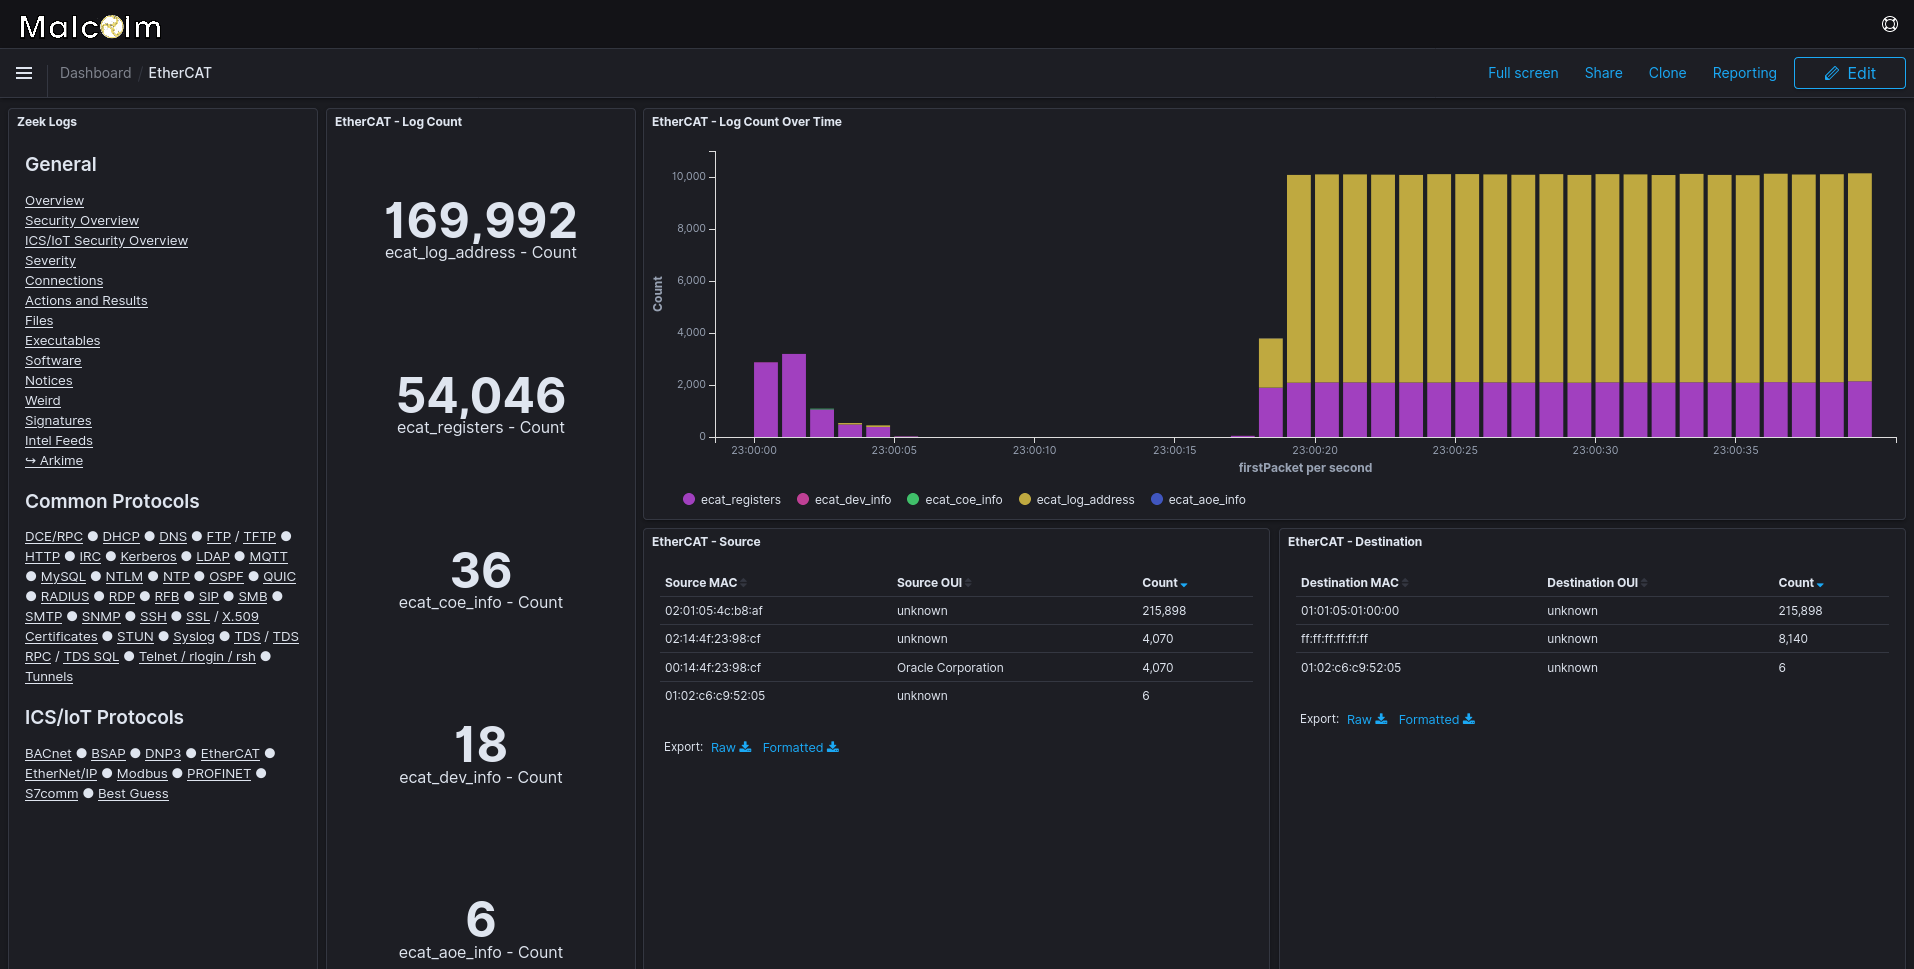
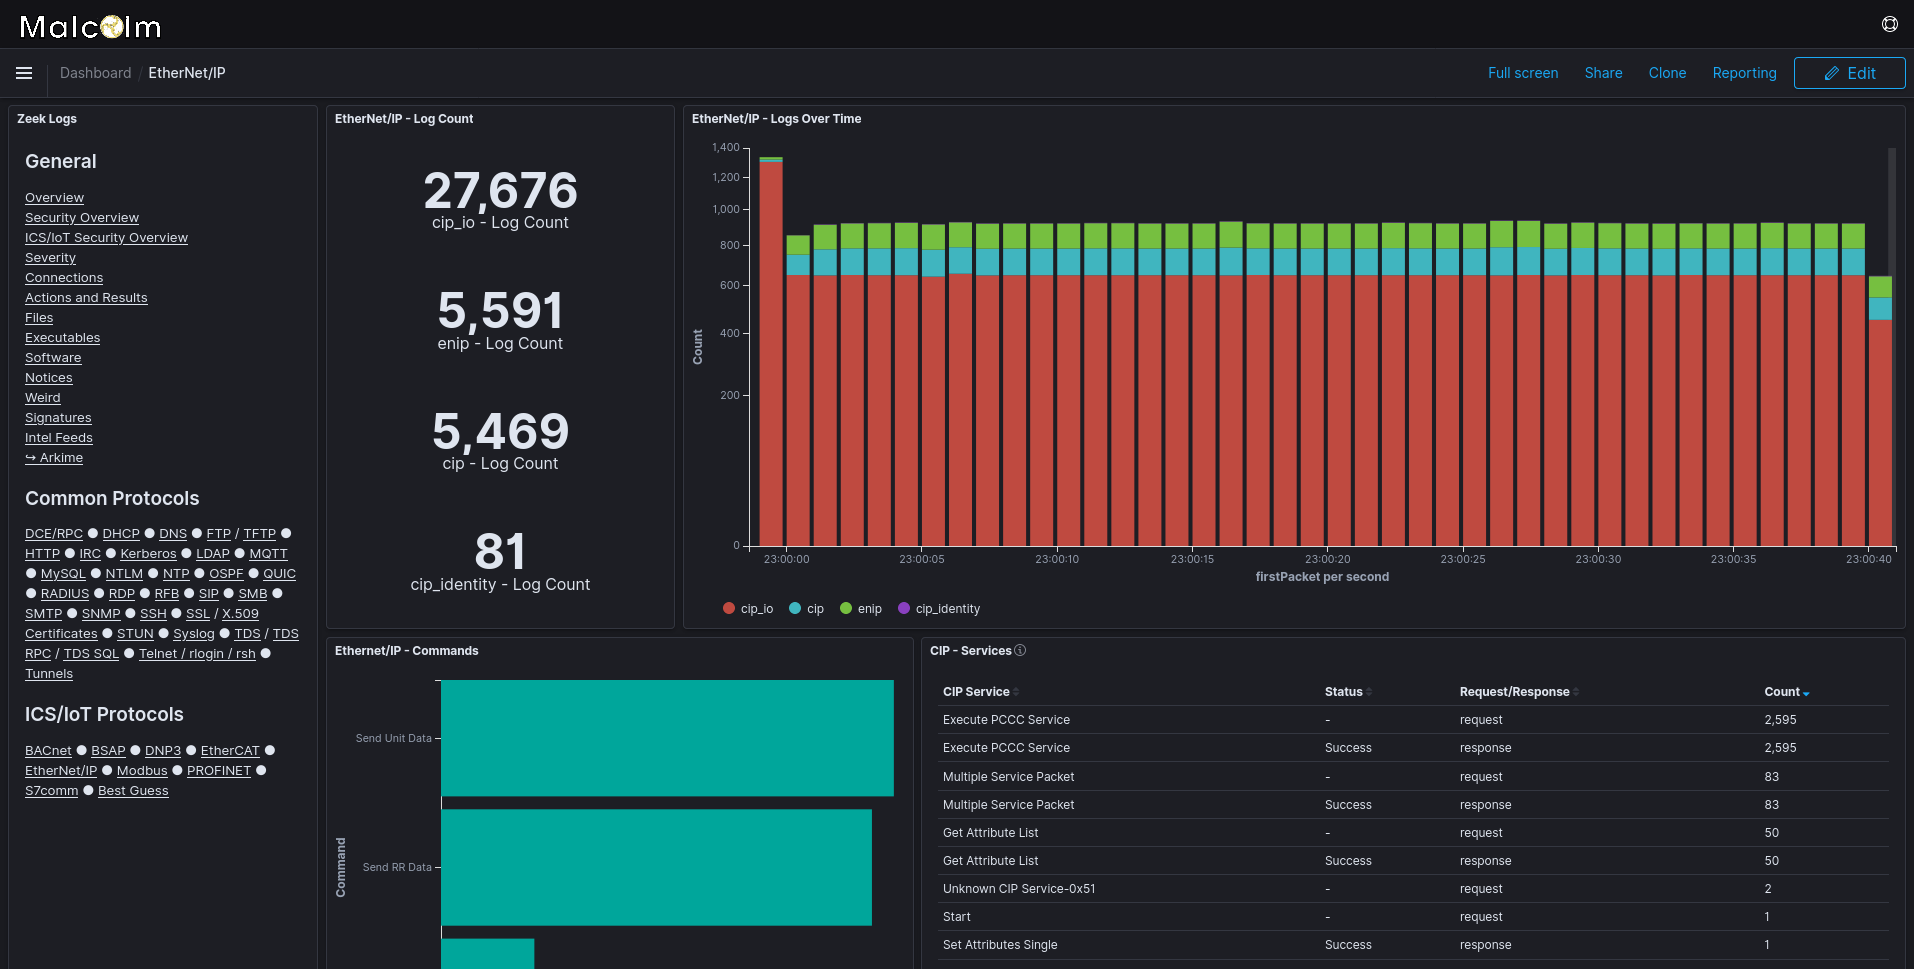
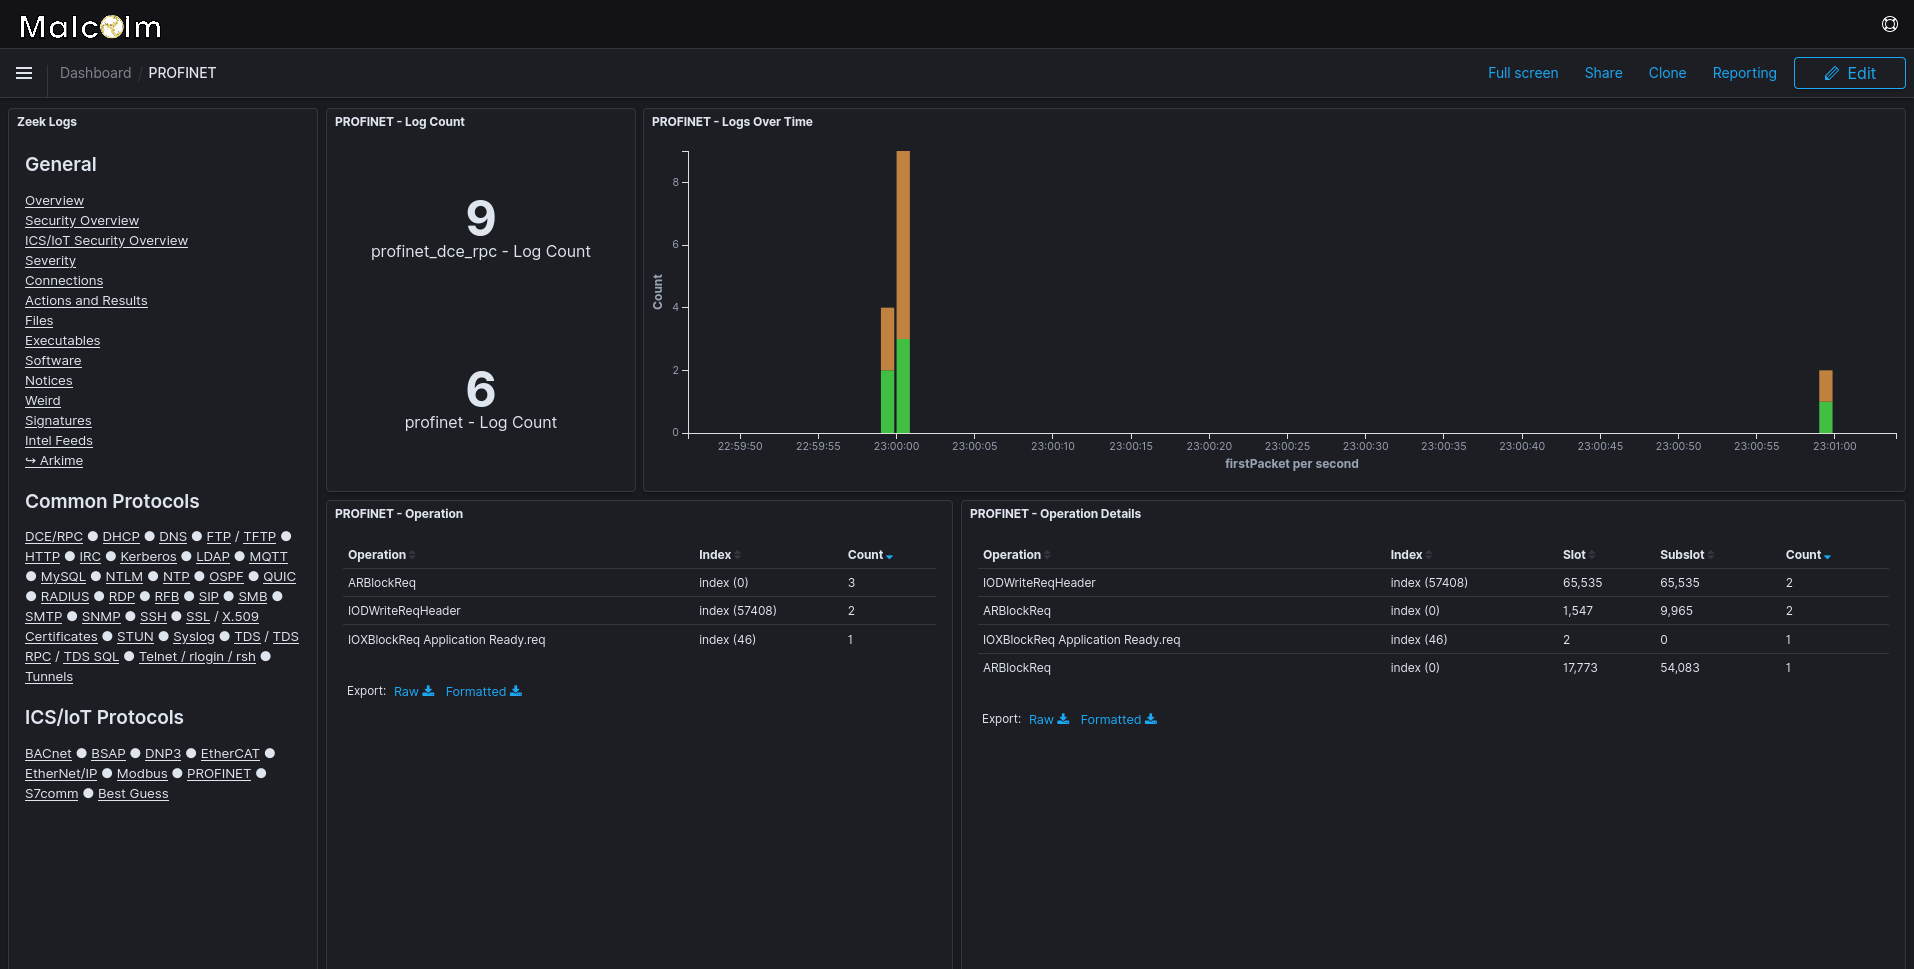
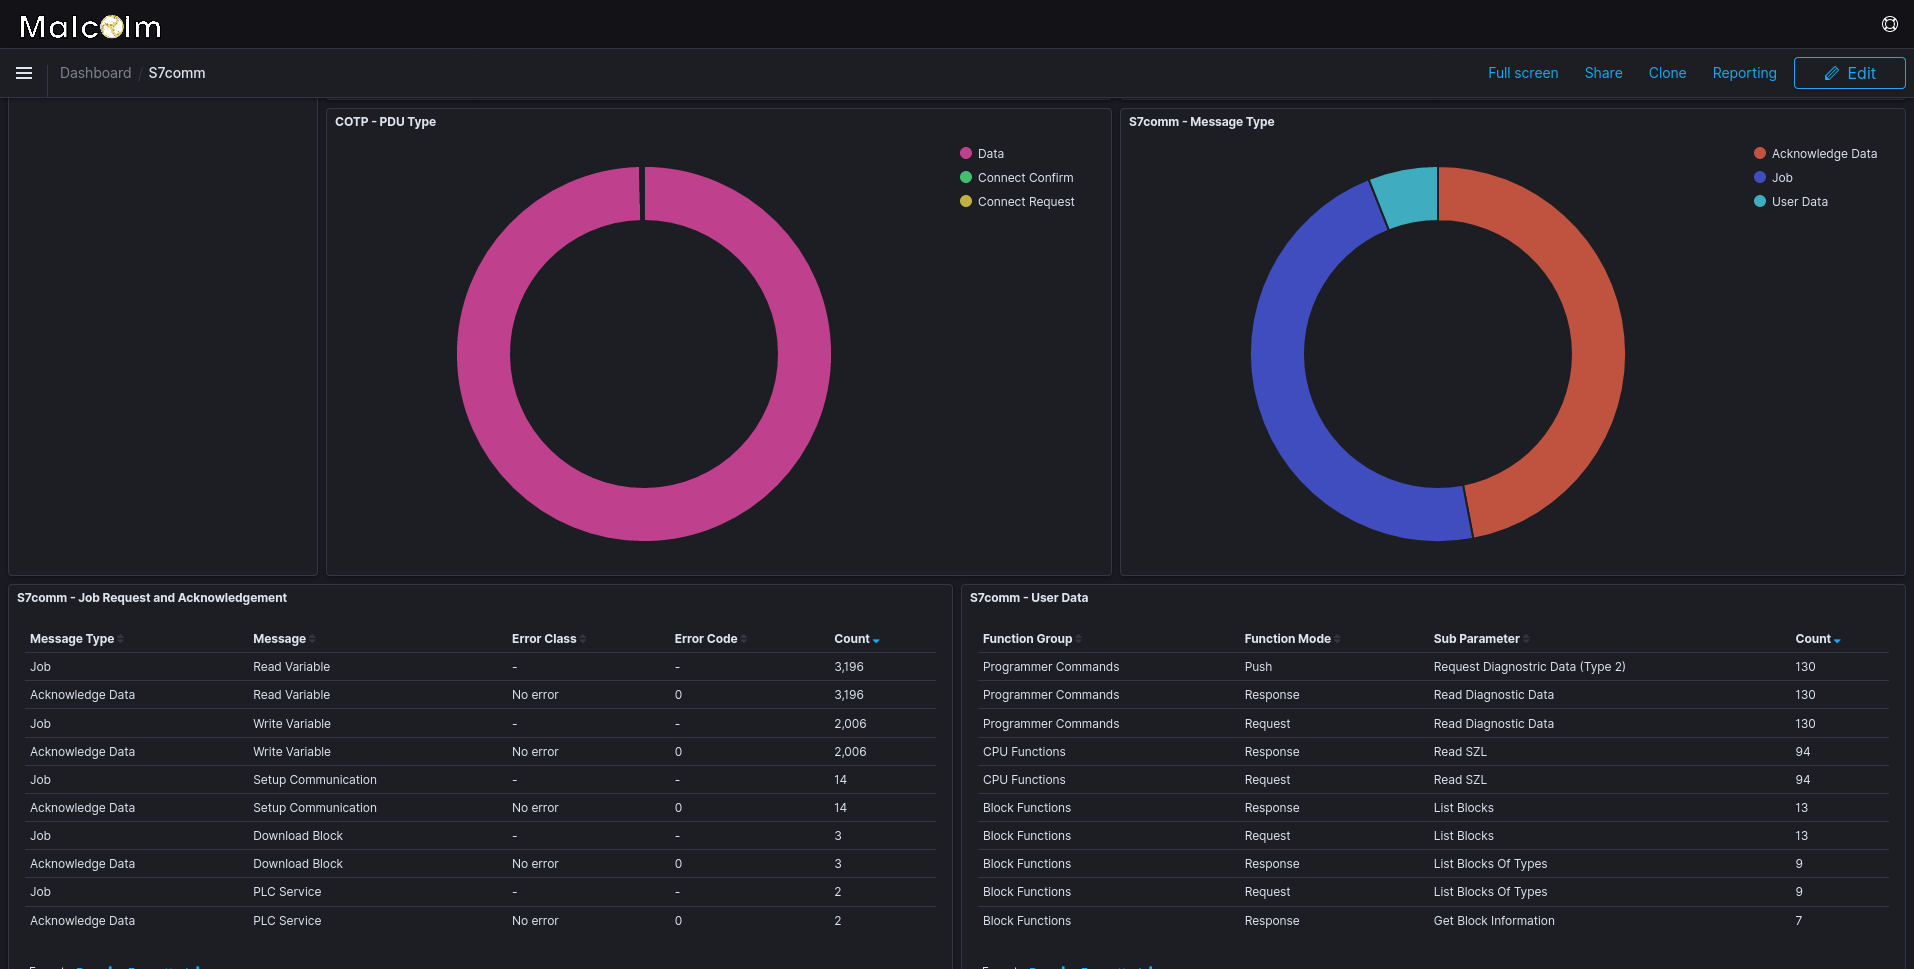
Prebuilt visualizations and dashboards

Malcolm comes with dozens of prebuilt visualizations and dashboards for the network traffic represented by each of the Zeek log types. Click Dashboard to see a list of these dashboards. As is the case with all OpenSearch Dashboards visualizations, all of the charts, graphs, maps, and tables are interactive and can be clicked on to narrow or expand the scope of the data under investigation. Similarly, click Visualize to explore the prebuilt visualizations used to build the dashboards.

Inspiration for many of Malcolm’s prebuilt visualizations for Zeek logs was originally drawn from Security Onion’s excellent Kibana dashboards.

Screenshots

The Security Overview highlights security-related network events

The ICS/IoT Security Overview dashboard displays information about ICS and IoT network traffic

The Connections dashboard displays information about the "top talkers" across all types of sessions

The HTTP dashboard displays important details about HTTP traffic

There are several Connections visualizations using locations from GeoIP lookups

OpenSearch Dashboards includes both coordinate and region map types

The Suricata Alerts dashboard highlights traffic which matched Suricata signatures

The Zeek Notices dashboard highlights things which Zeek determine are potentially bad

The Zeek Signatures dashboard displays signature hits, such as antivirus hits on files extracted from network traffic

The Software dashboard displays the type, name, and version of software seen communicating on the network

The PE (portable executables) dashboard displays information about executable files transferred over the network

The SMTP dashboard highlights details about SMTP traffic

The SSL dashboard displays information about SSL versions, certificates, and TLS JA3 fingerprints

The files dashboard displays metrics about the files transferred over the network

This dashboard provides insight into DNP3 (Distributed Network Protocol), a protocol used commonly in electric and water utilities

Modbus is a standard protocol found in many industrial control systems (ICS)

BACnet is a communications protocol for Building Automation and Control (BAC) networks

EtherCAT is an Ethernet-based fieldbus system

EtherNet/IP is an industrial network protocol that adapts the Common Industrial Protocol to standard Ethernet

PROFINET is an industry technical standard for data communication over Industrial Ethernet

S7comm is a Siemens proprietary protocol that runs between programmable logic controllers (PLCs) of the Siemens family

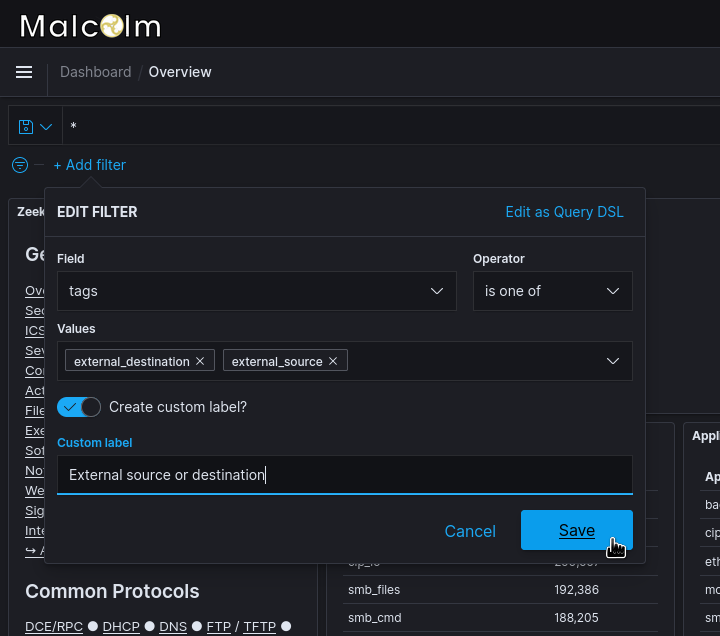
Building visualizations and dashboards

See the official Kibana User Guide and OpenSearch Dashboards (OpenSearch Dashboards is an open-source fork of Kibana, which is no longer open-source software) documentation for information on creating custom visualizations and dashboards:

Screenshots

OpenSearch dashboards boasts many types of visualizations for displaying your data