A powerful, easily deployable network traffic analysis tool suite for network security monitoring
OpenSearch Dashboards
While Arkime provides very nice visualizations, especially for network traffic, OpenSearch Dashboards (an open-source general-purpose data visualization tool for OpenSearch) can be used to create custom visualizations (tables, charts, graphs, dashboards, etc.) using the same data.
The OpenSearch Dashboards container can be accessed at https://localhost/dashboards/ if connecting locally. Several preconfigured dashboards for Zeek logs are included in Malcolm’s OpenSearch Dashboards configuration.
OpenSearch Dashboards has several components for data searching and visualization:
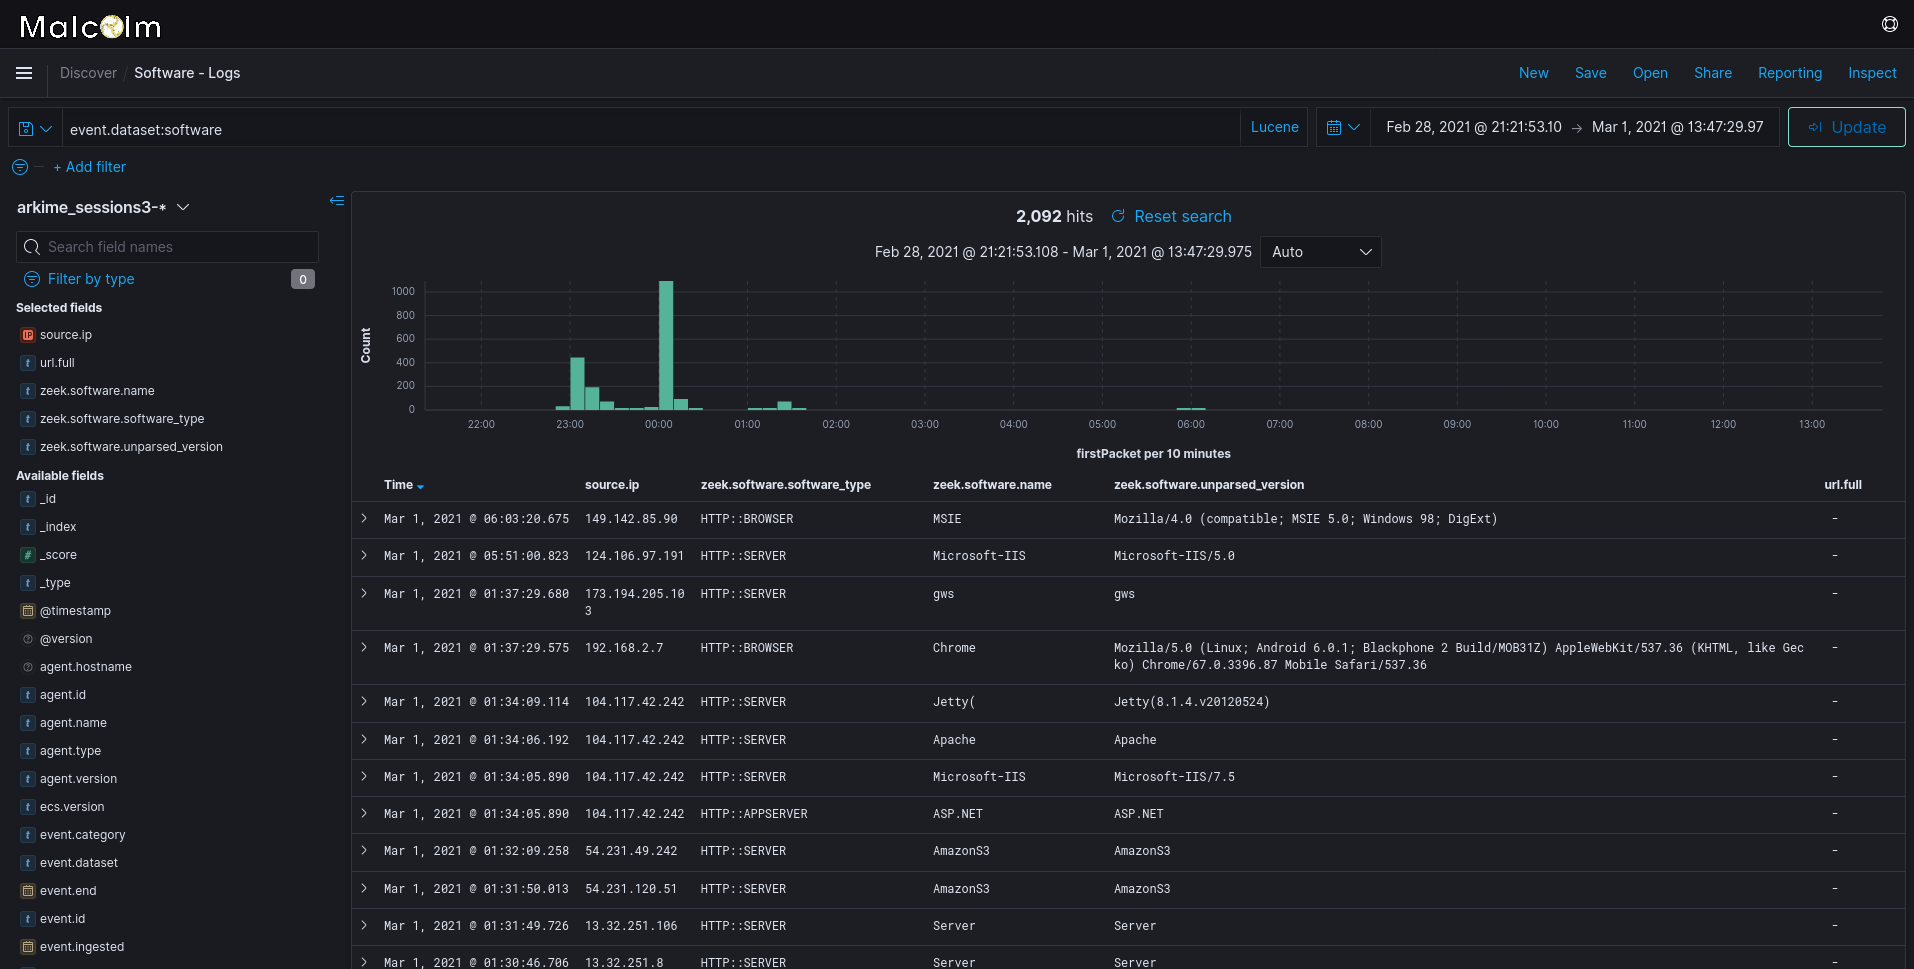
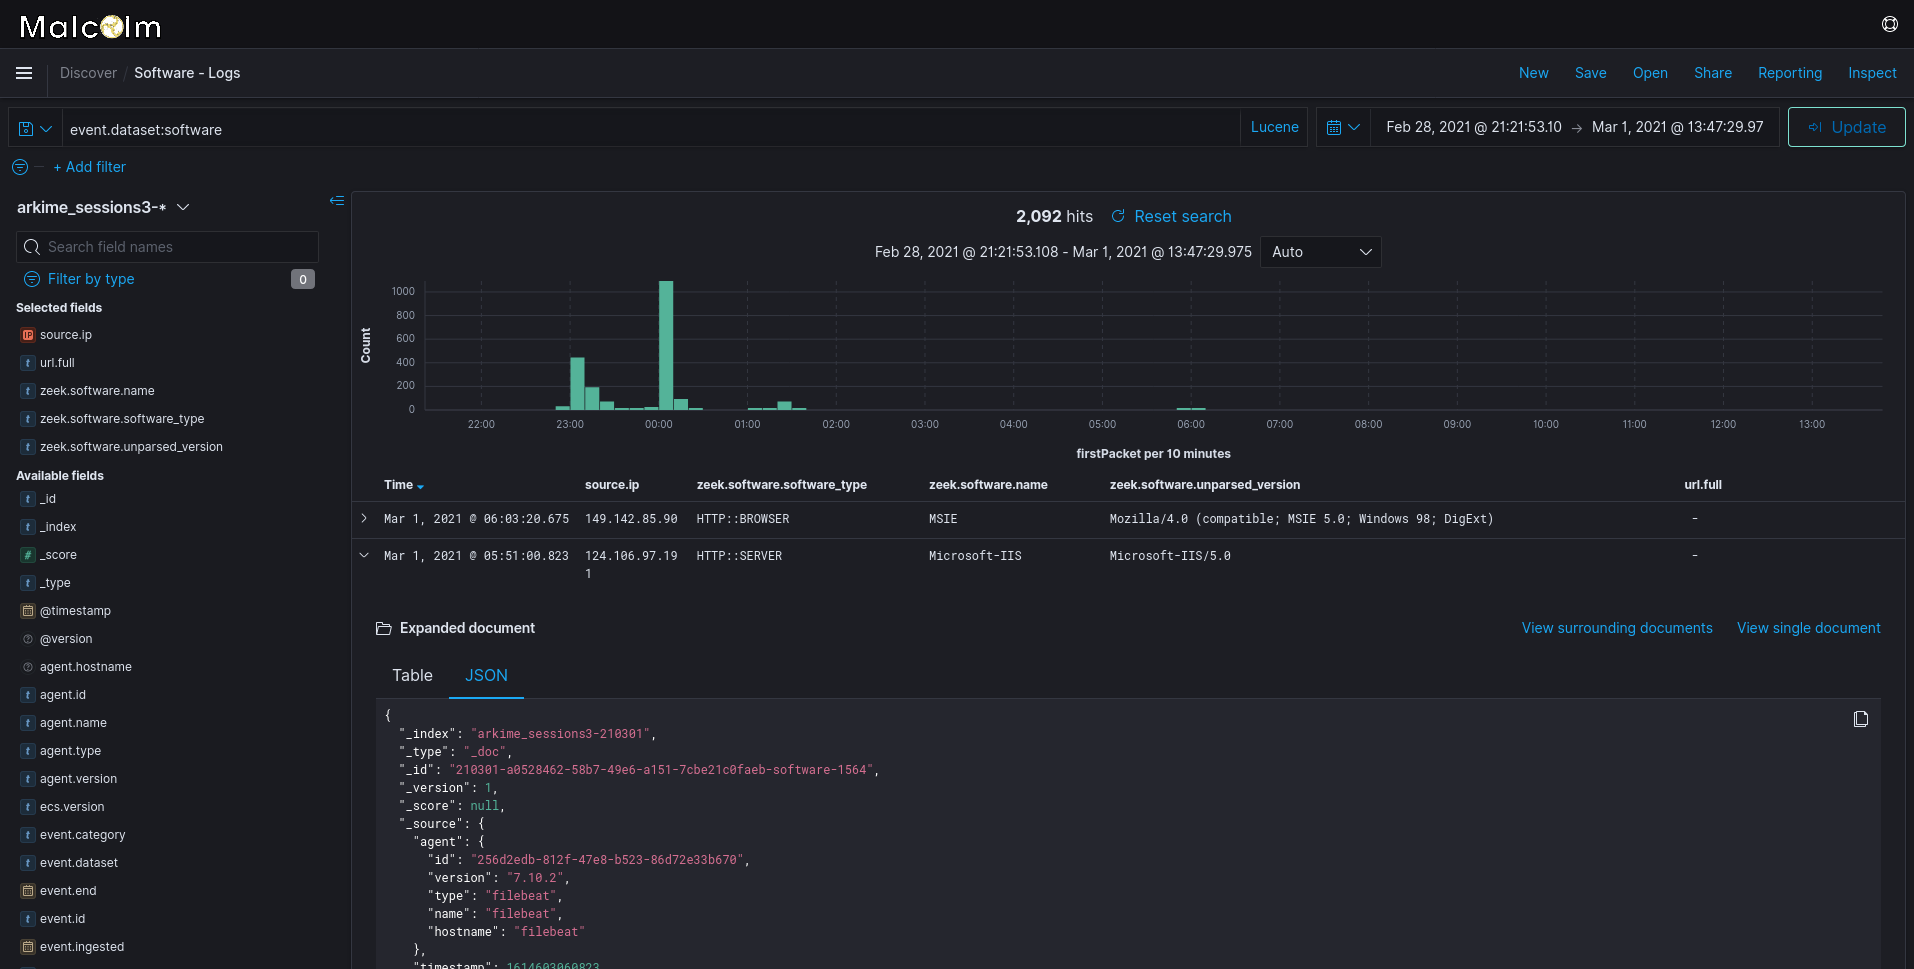
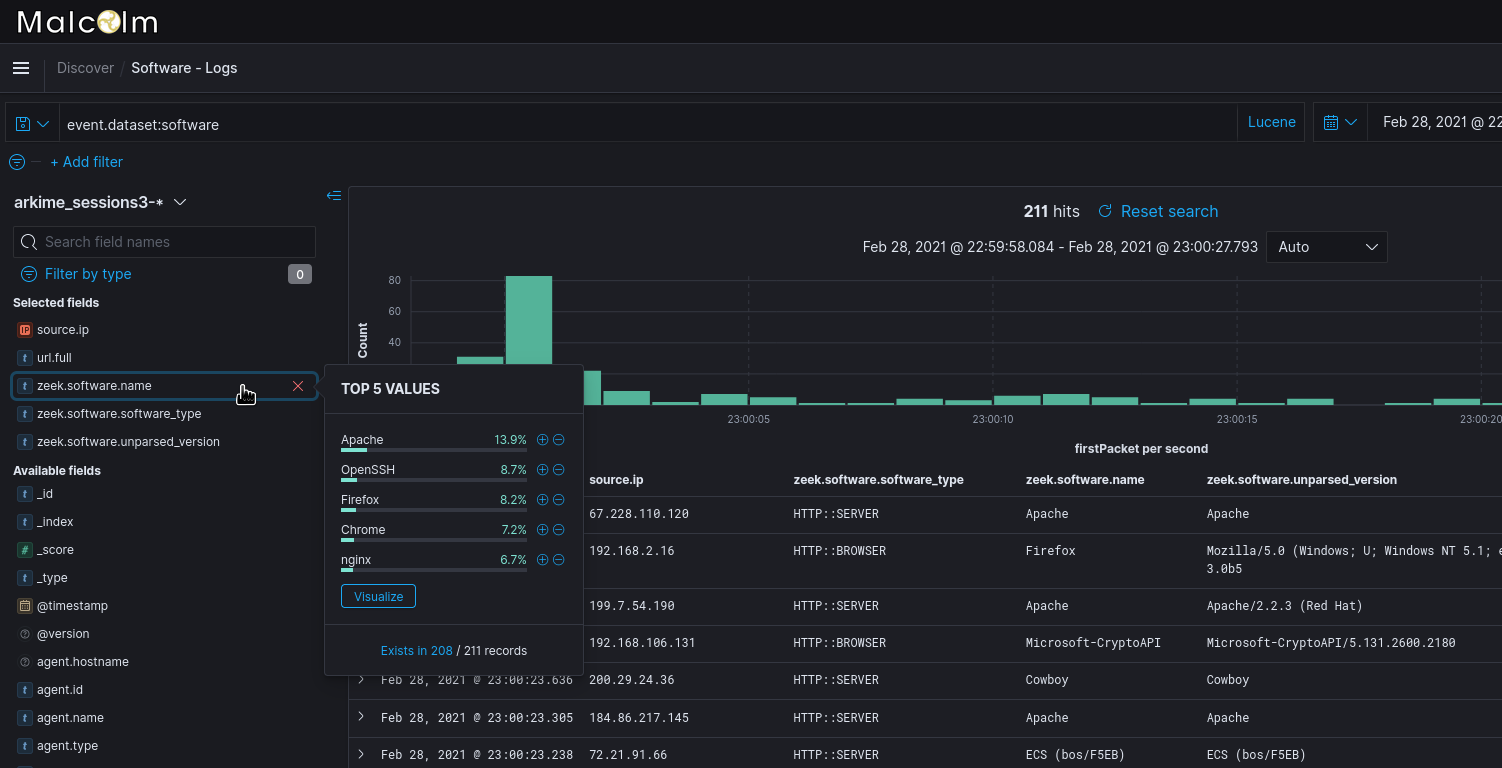
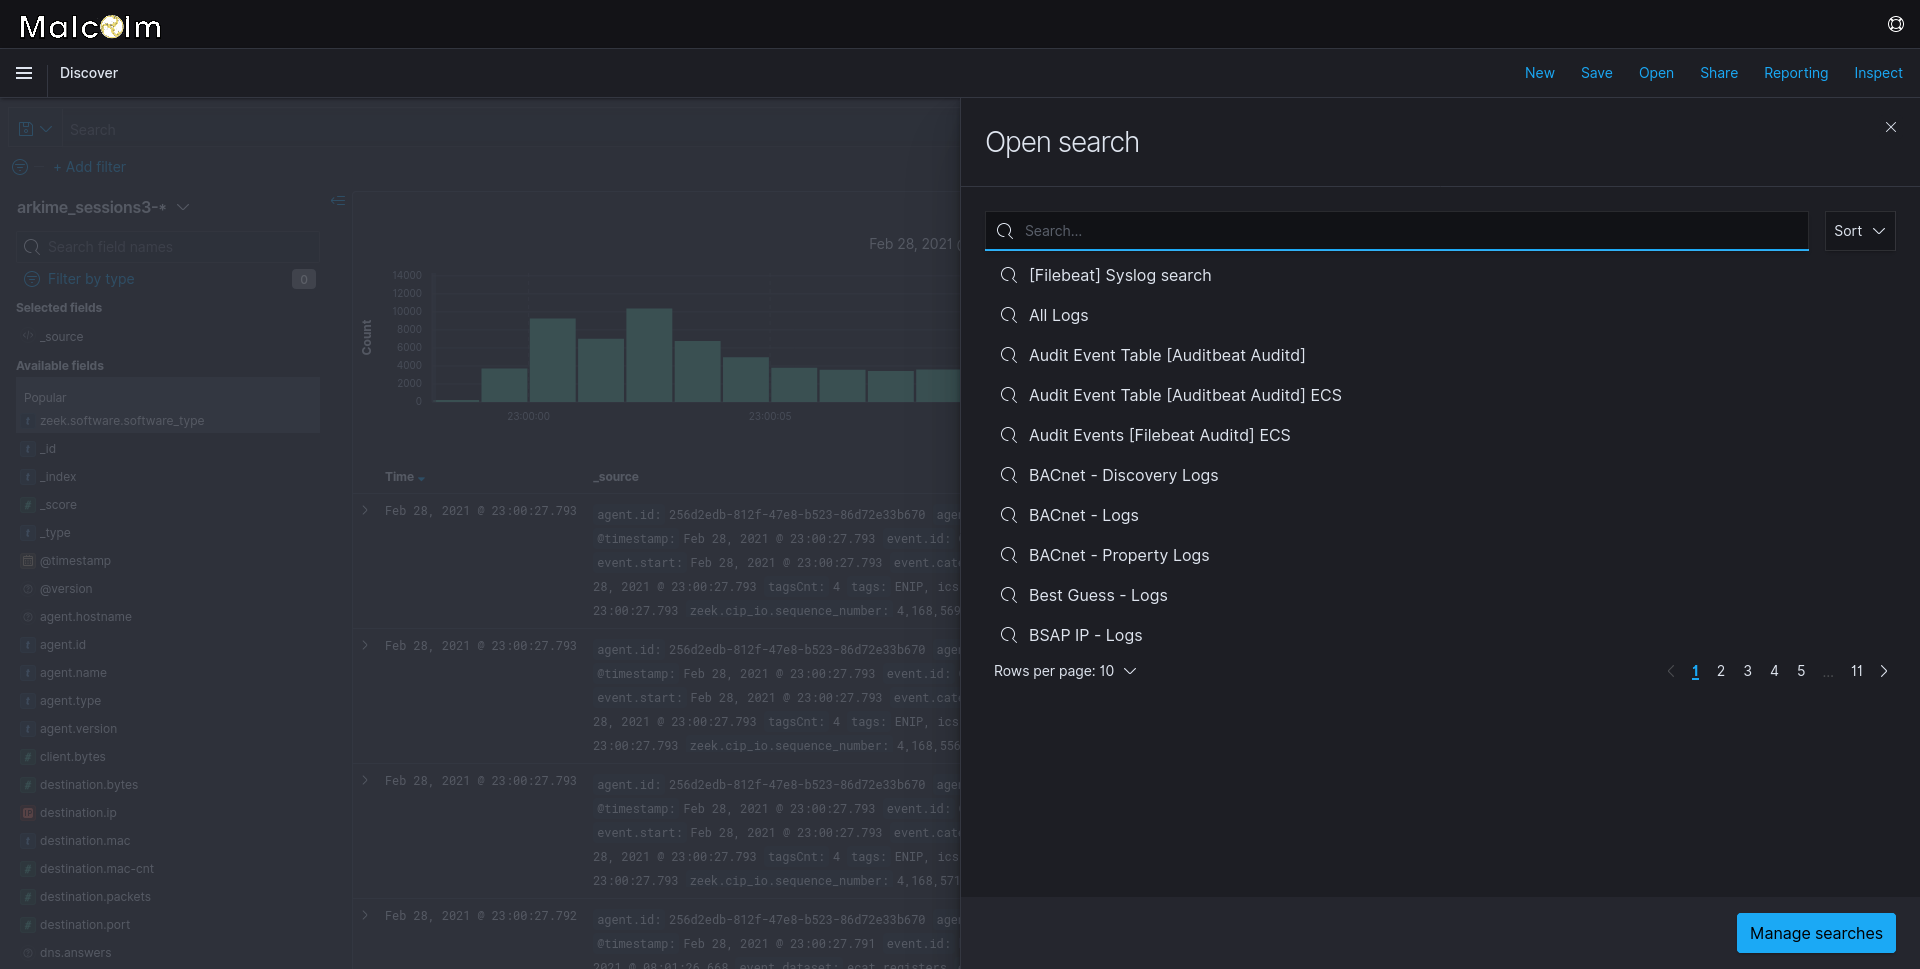
Discover
The Discover view enables users to view events on a record-by-record basis (similar to a session record in Arkime or an individual line from a Zeek log). See the official Kibana User Guide (OpenSearch Dashboards is an open-source fork of Kibana, which is no longer open-source software) for information on using the Discover view:
Screenshots
Visualizations and dashboards
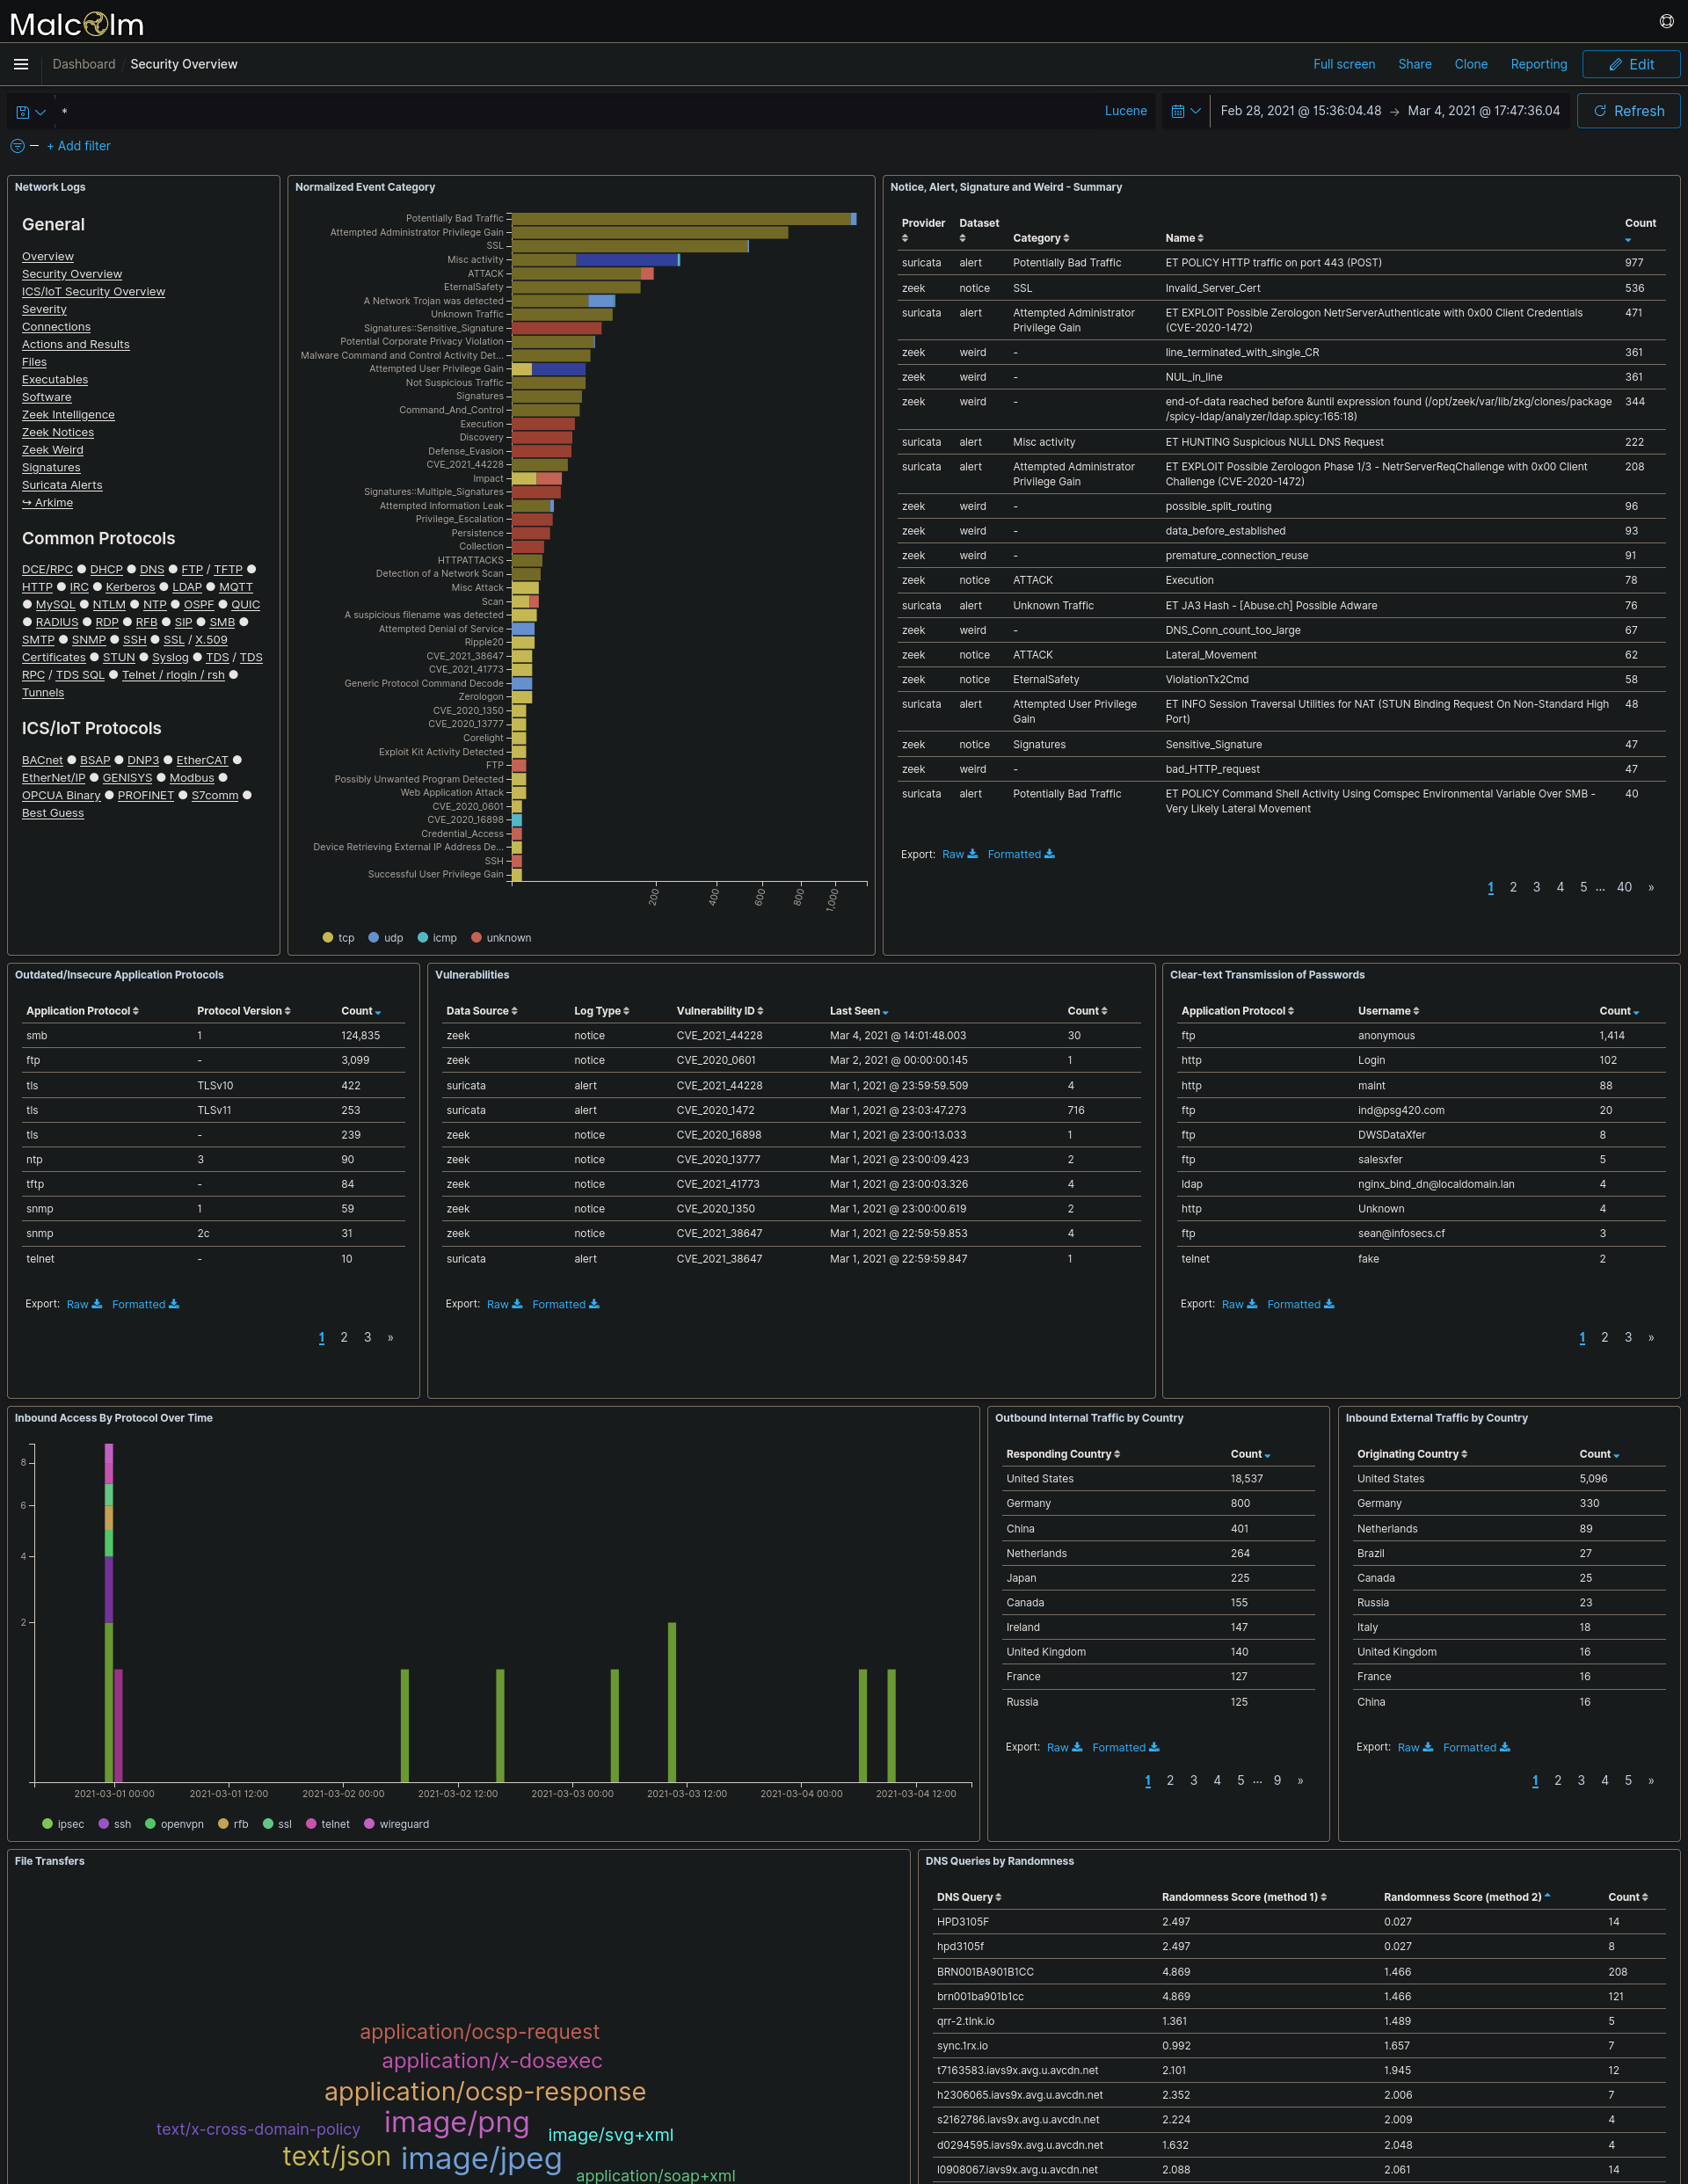
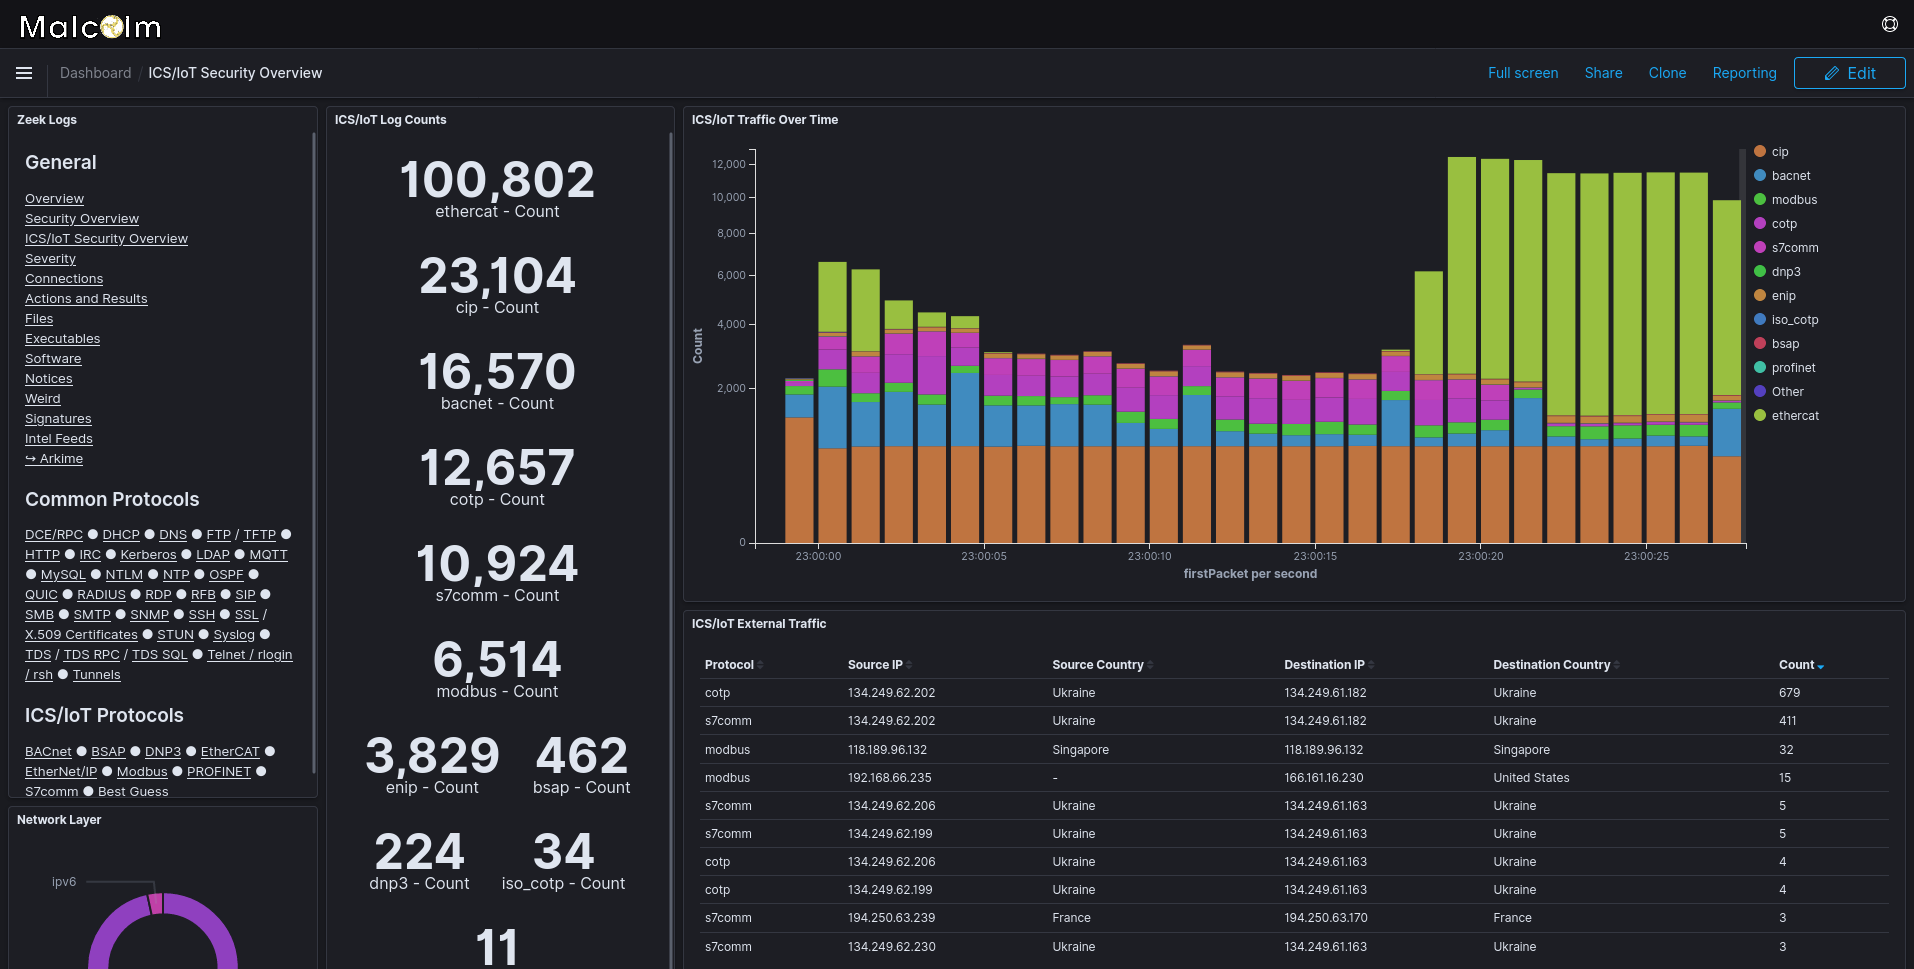
Prebuilt visualizations and dashboards
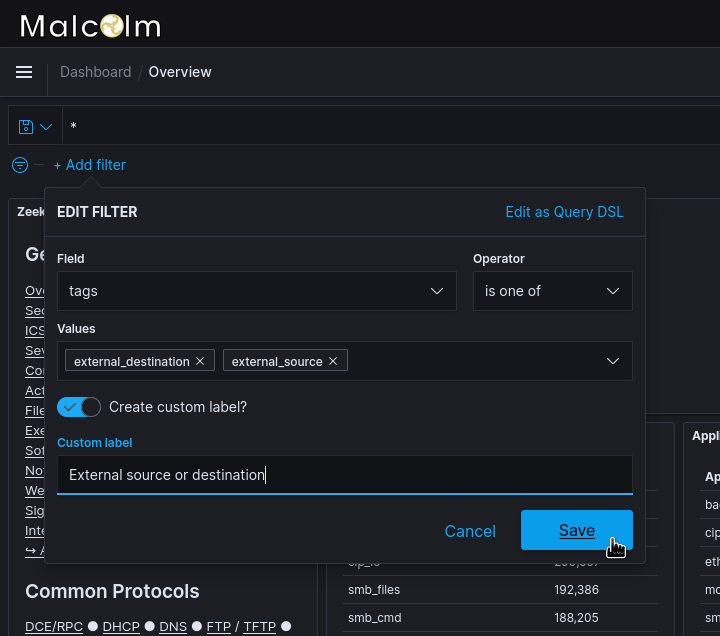
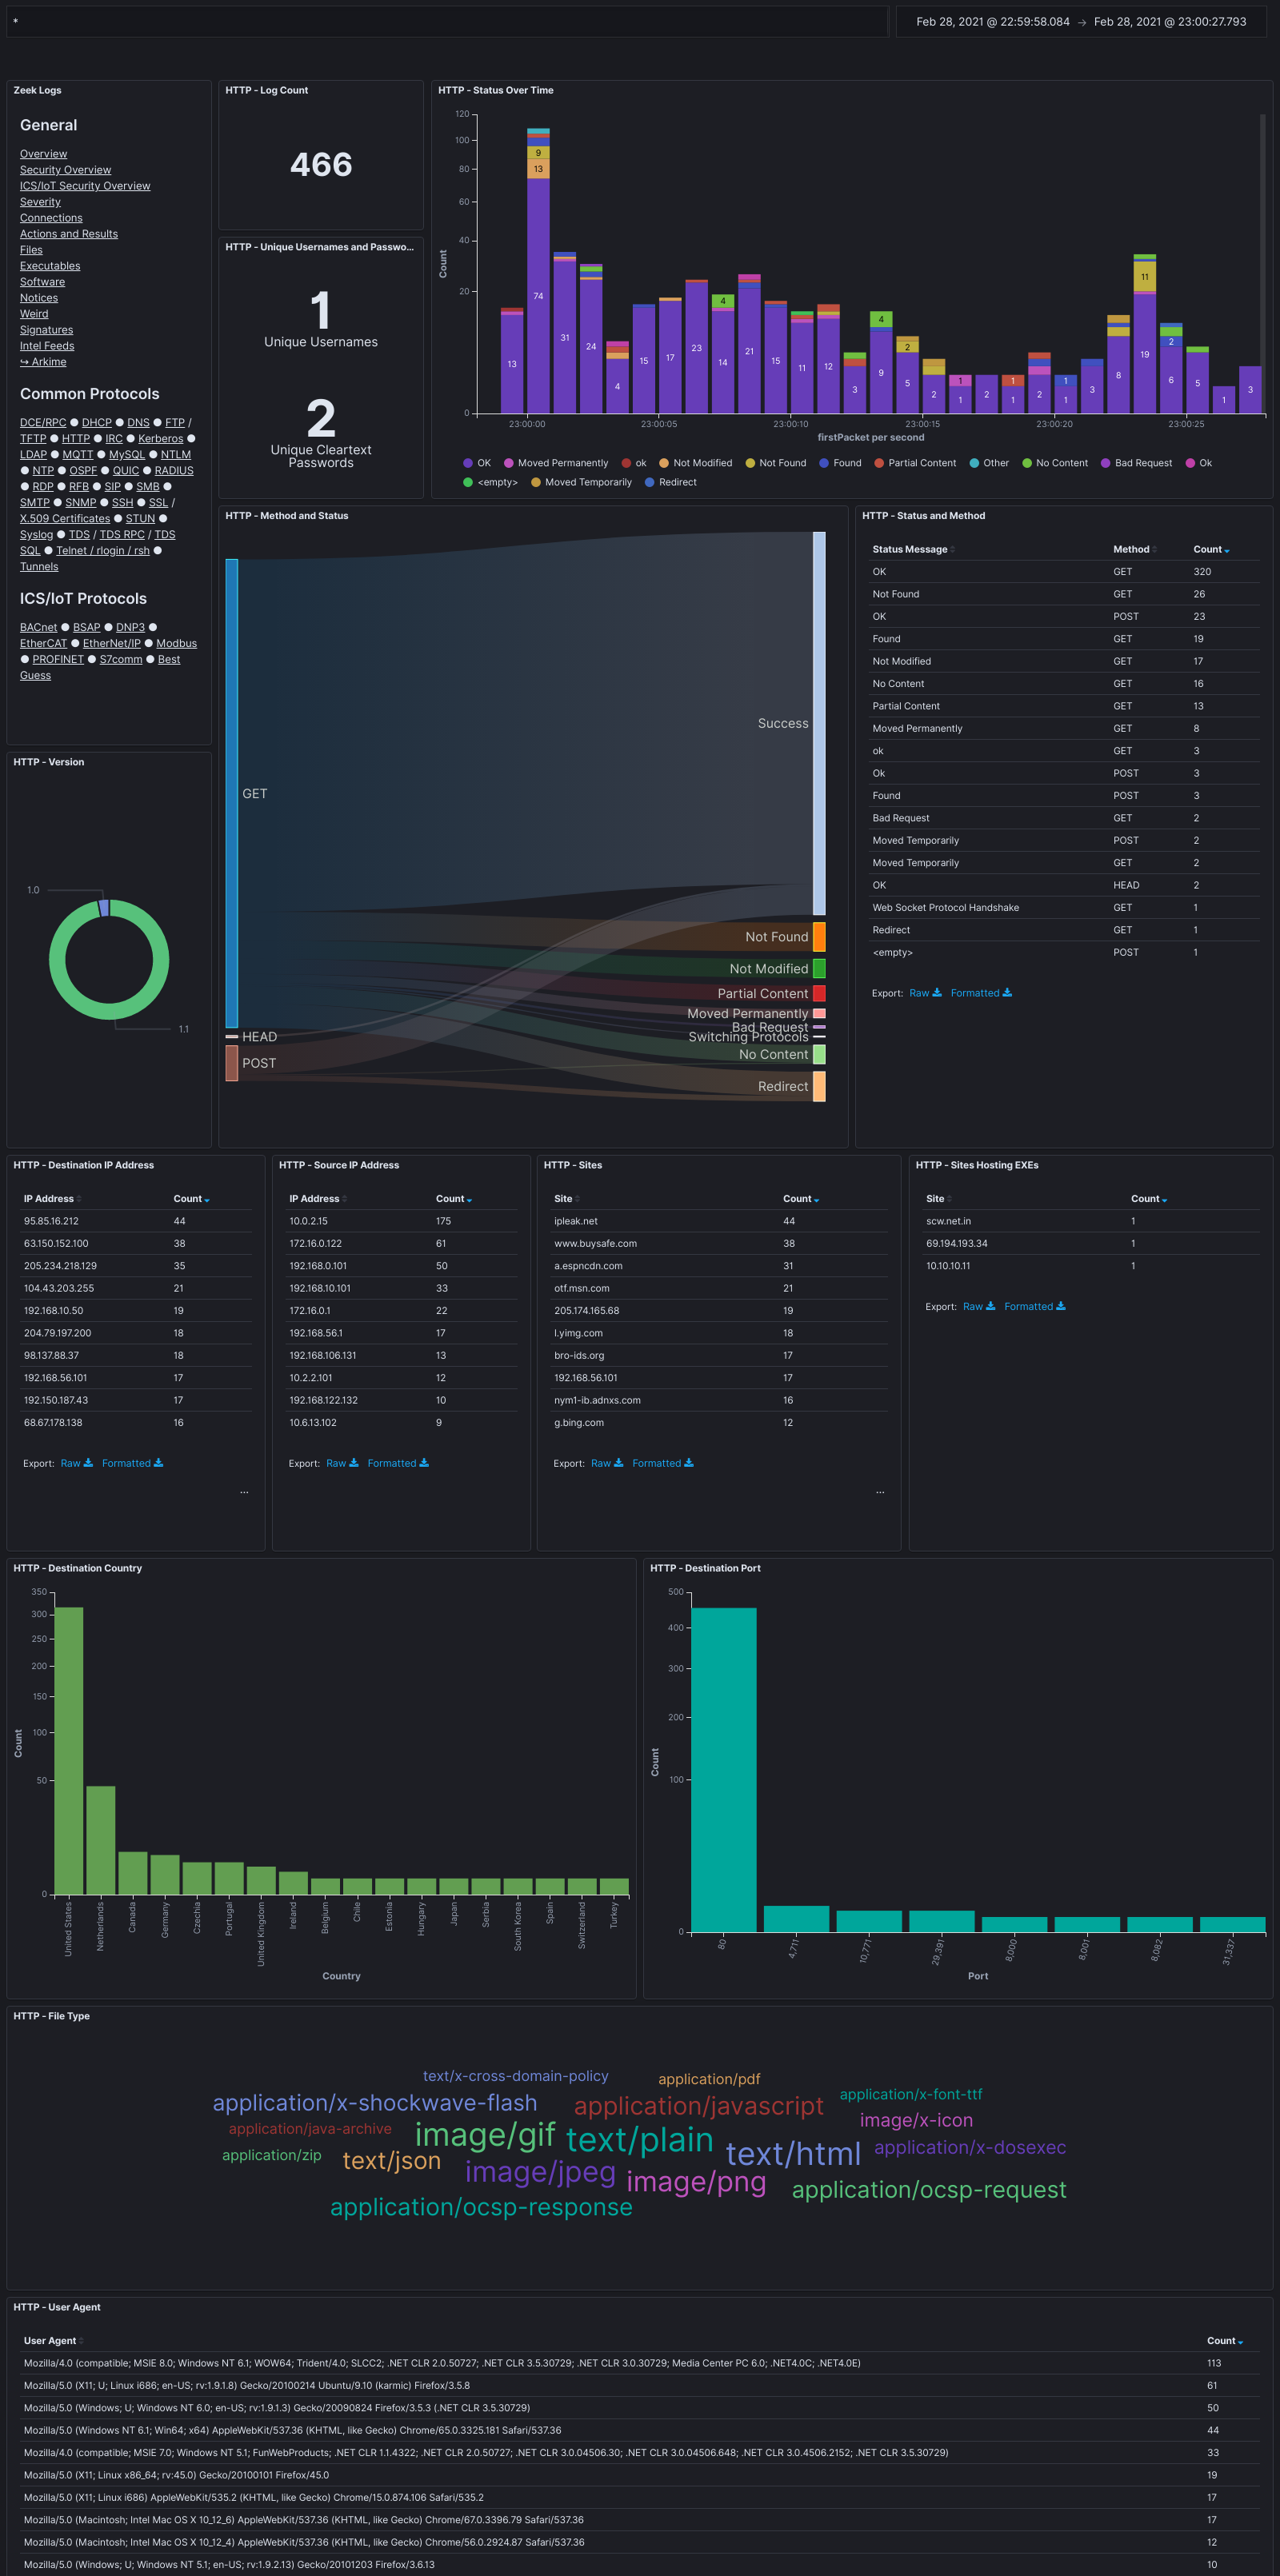
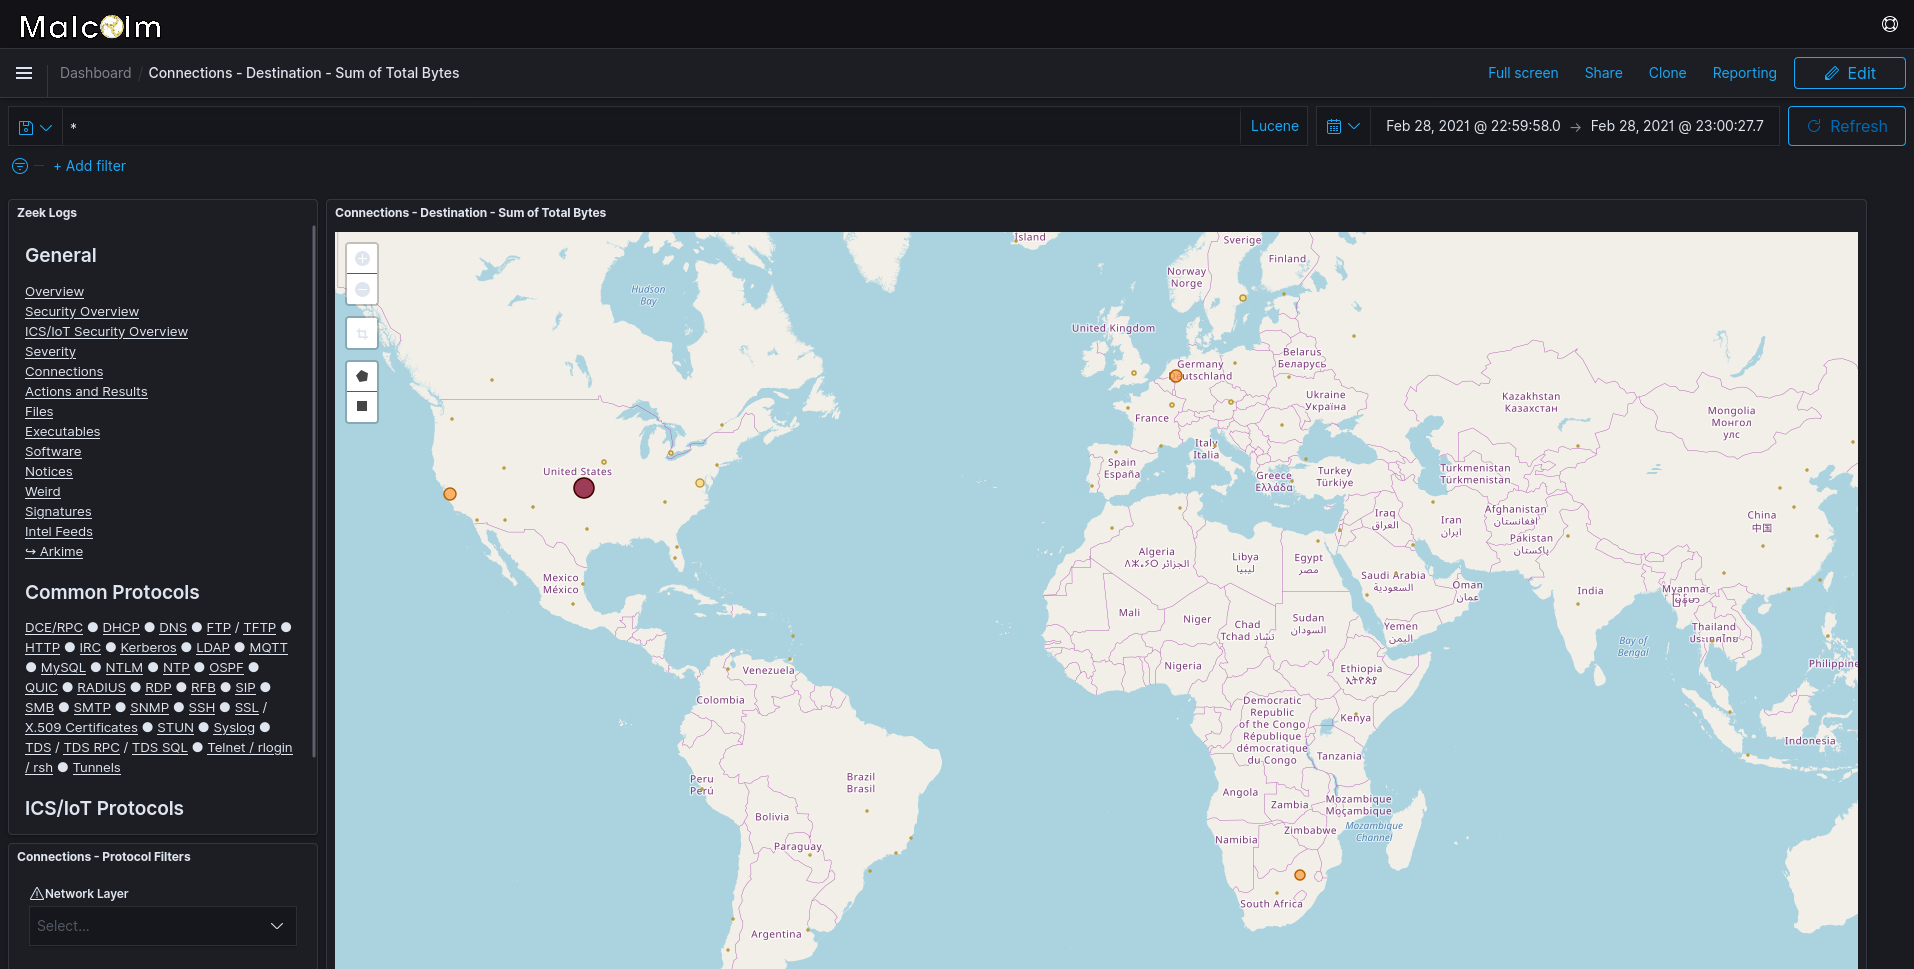
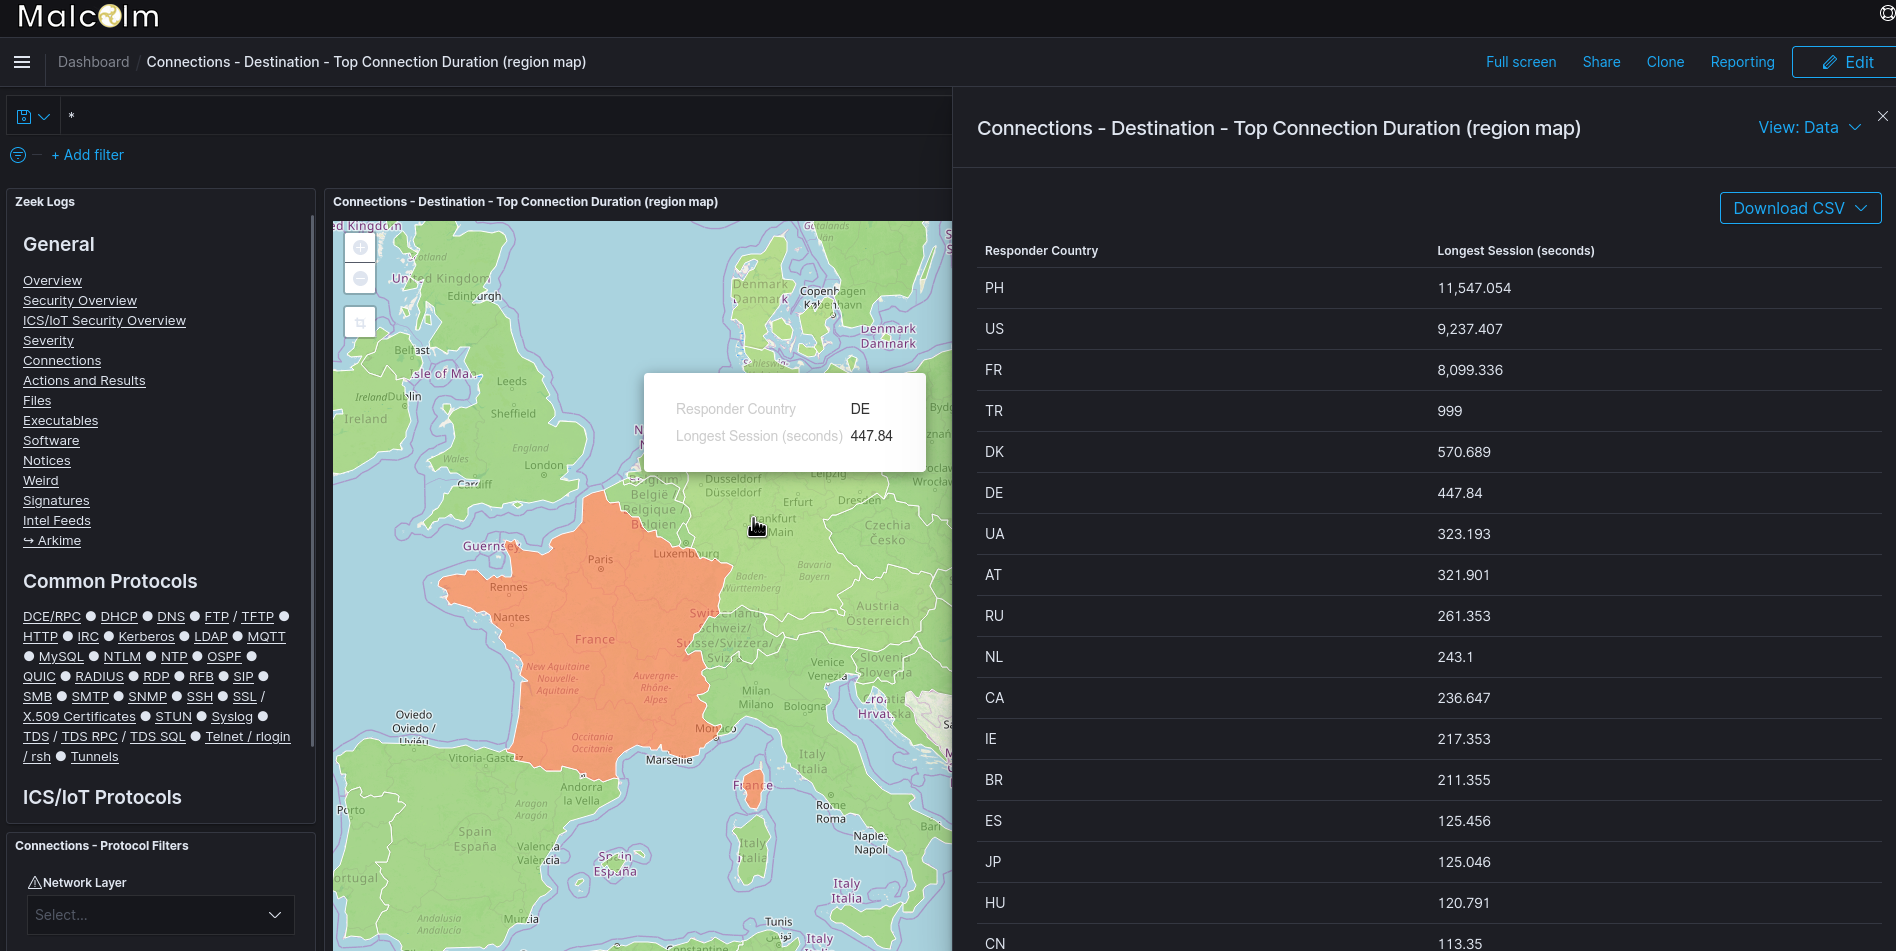
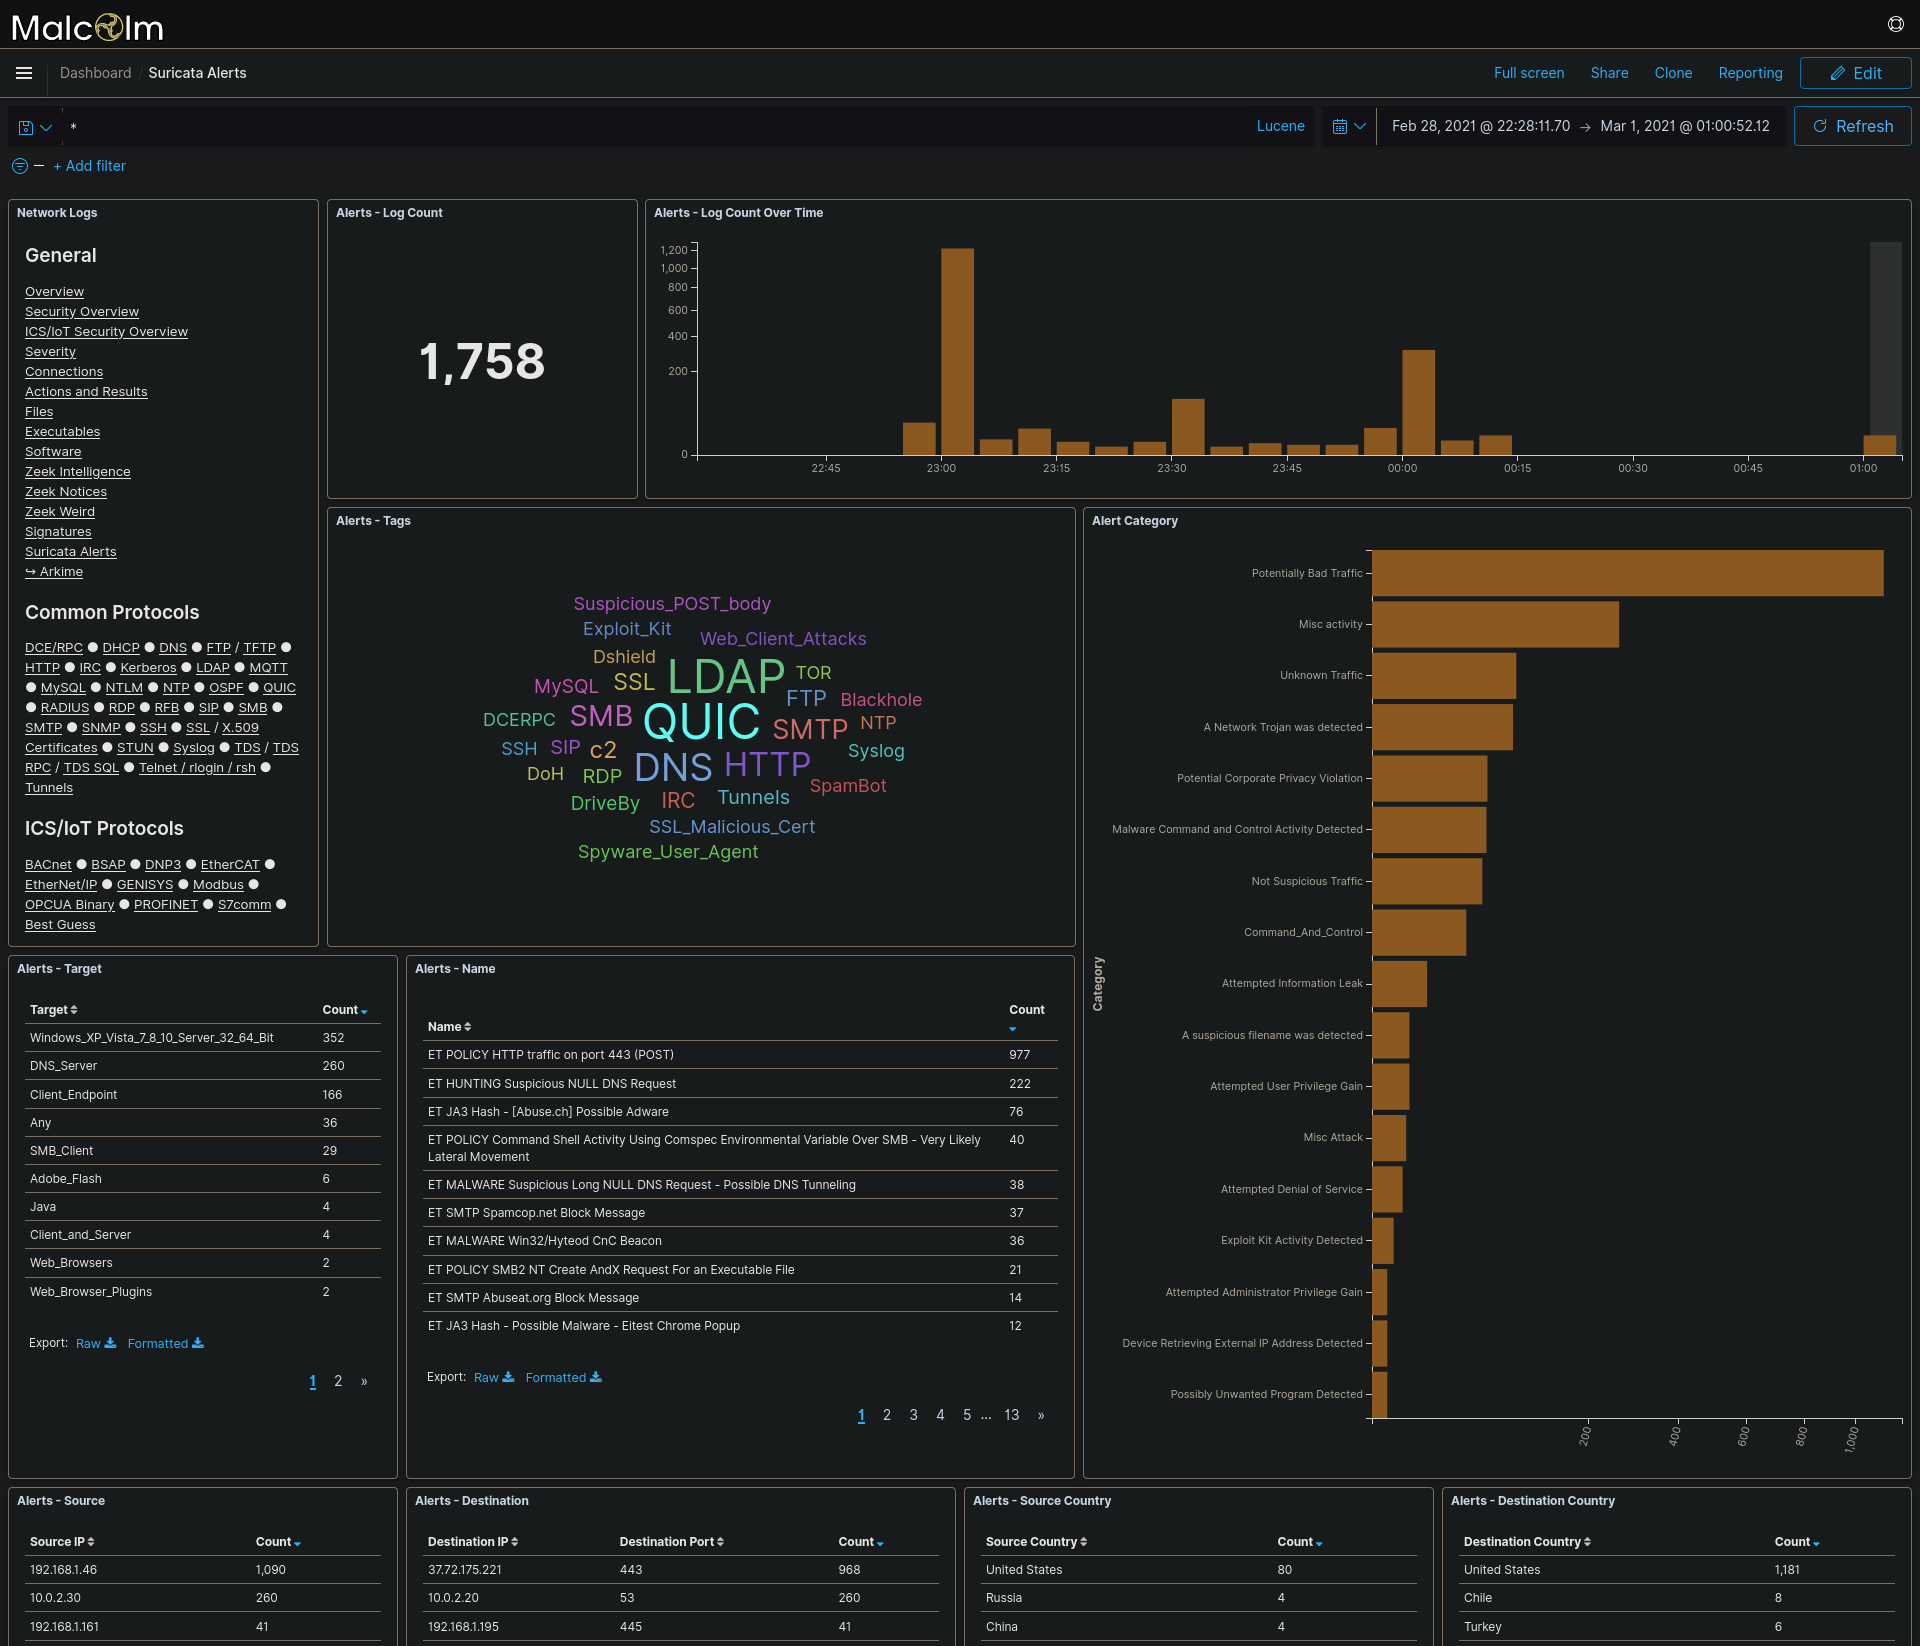
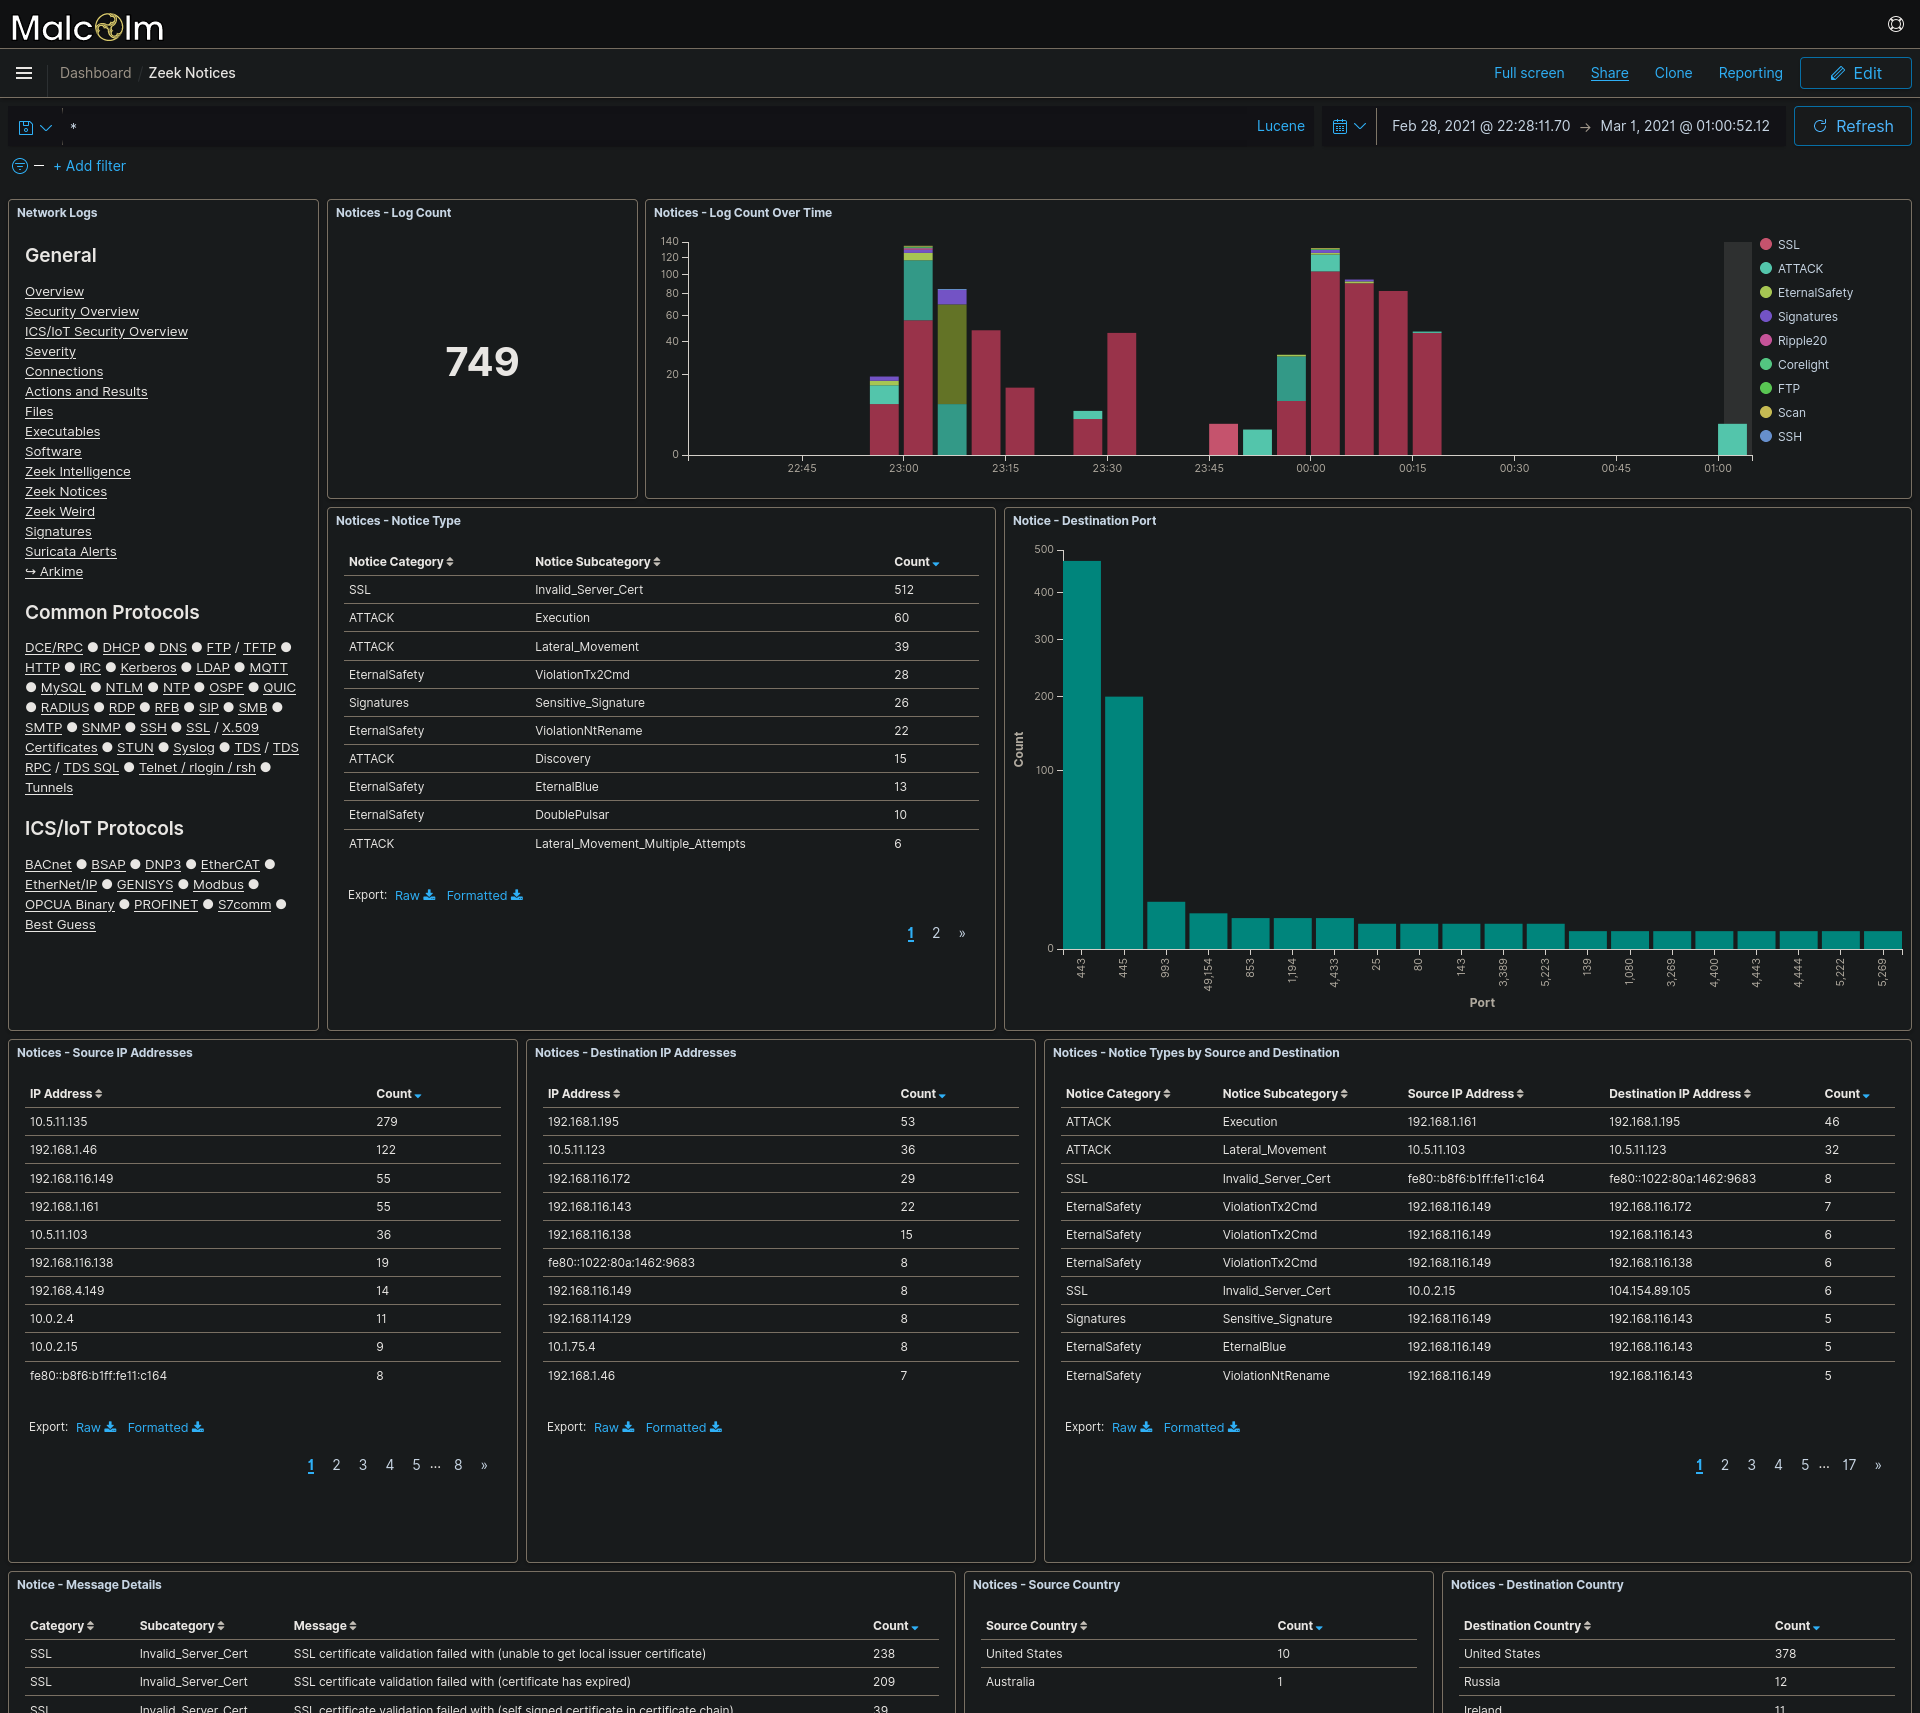
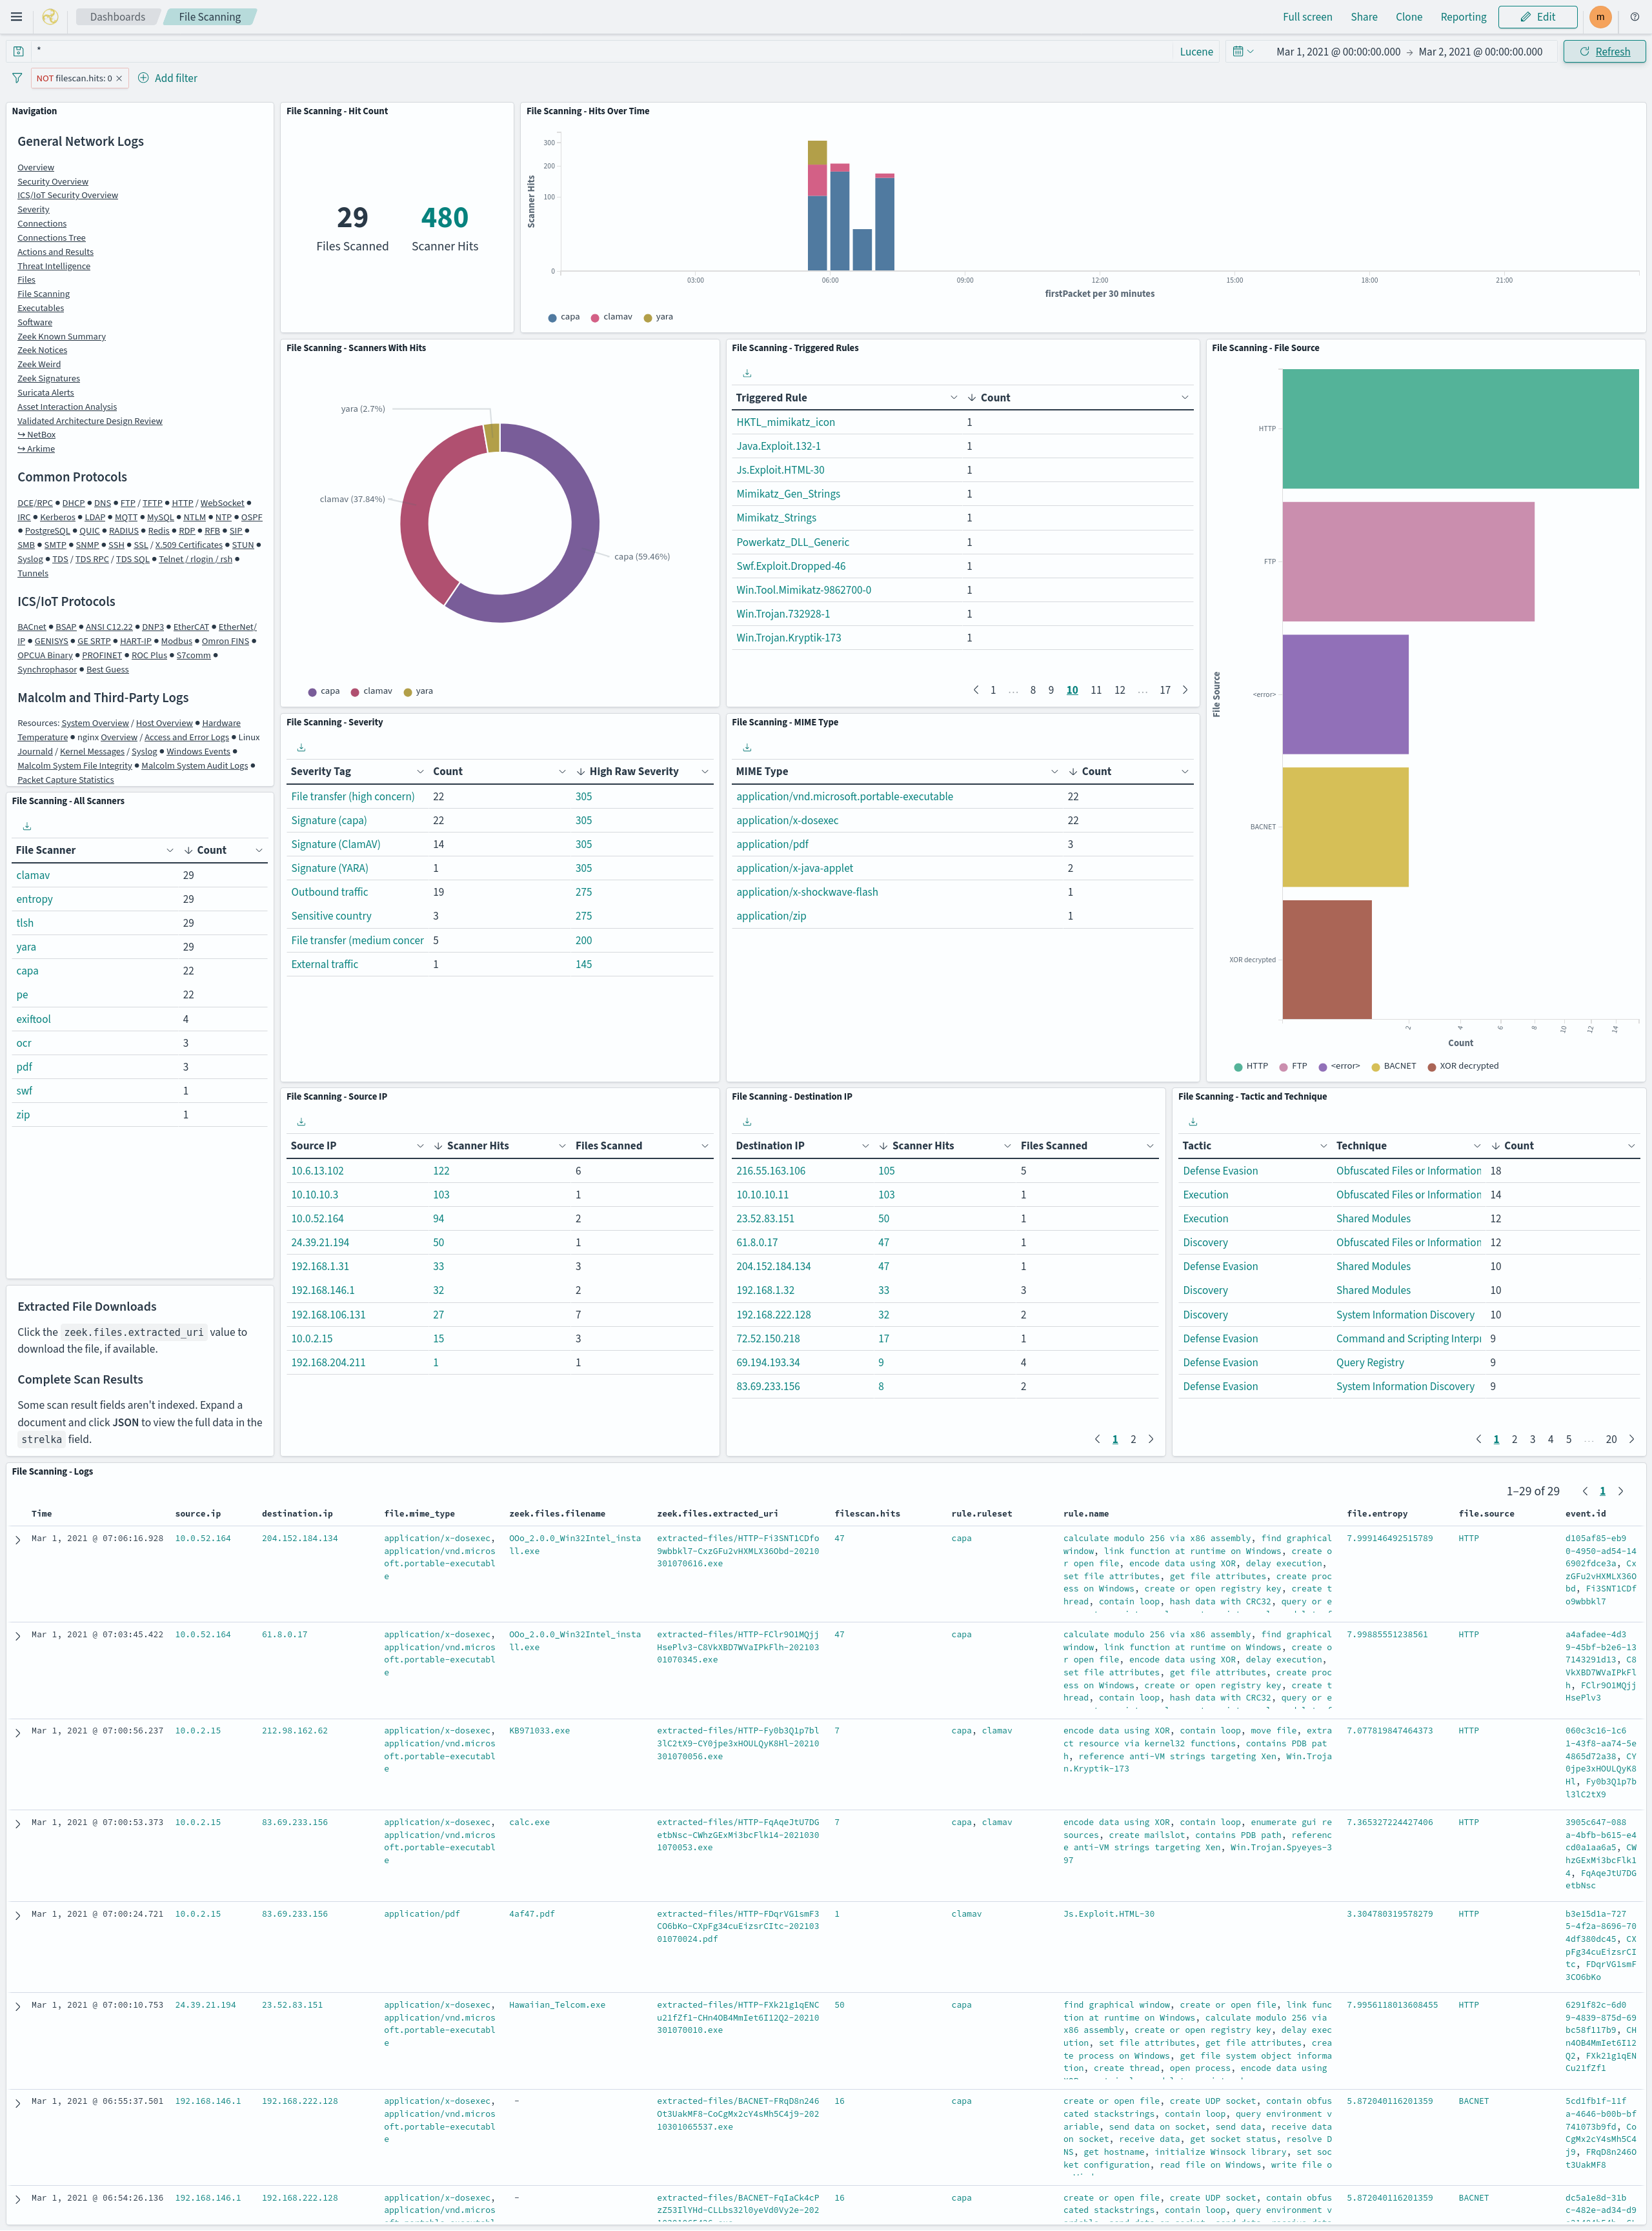
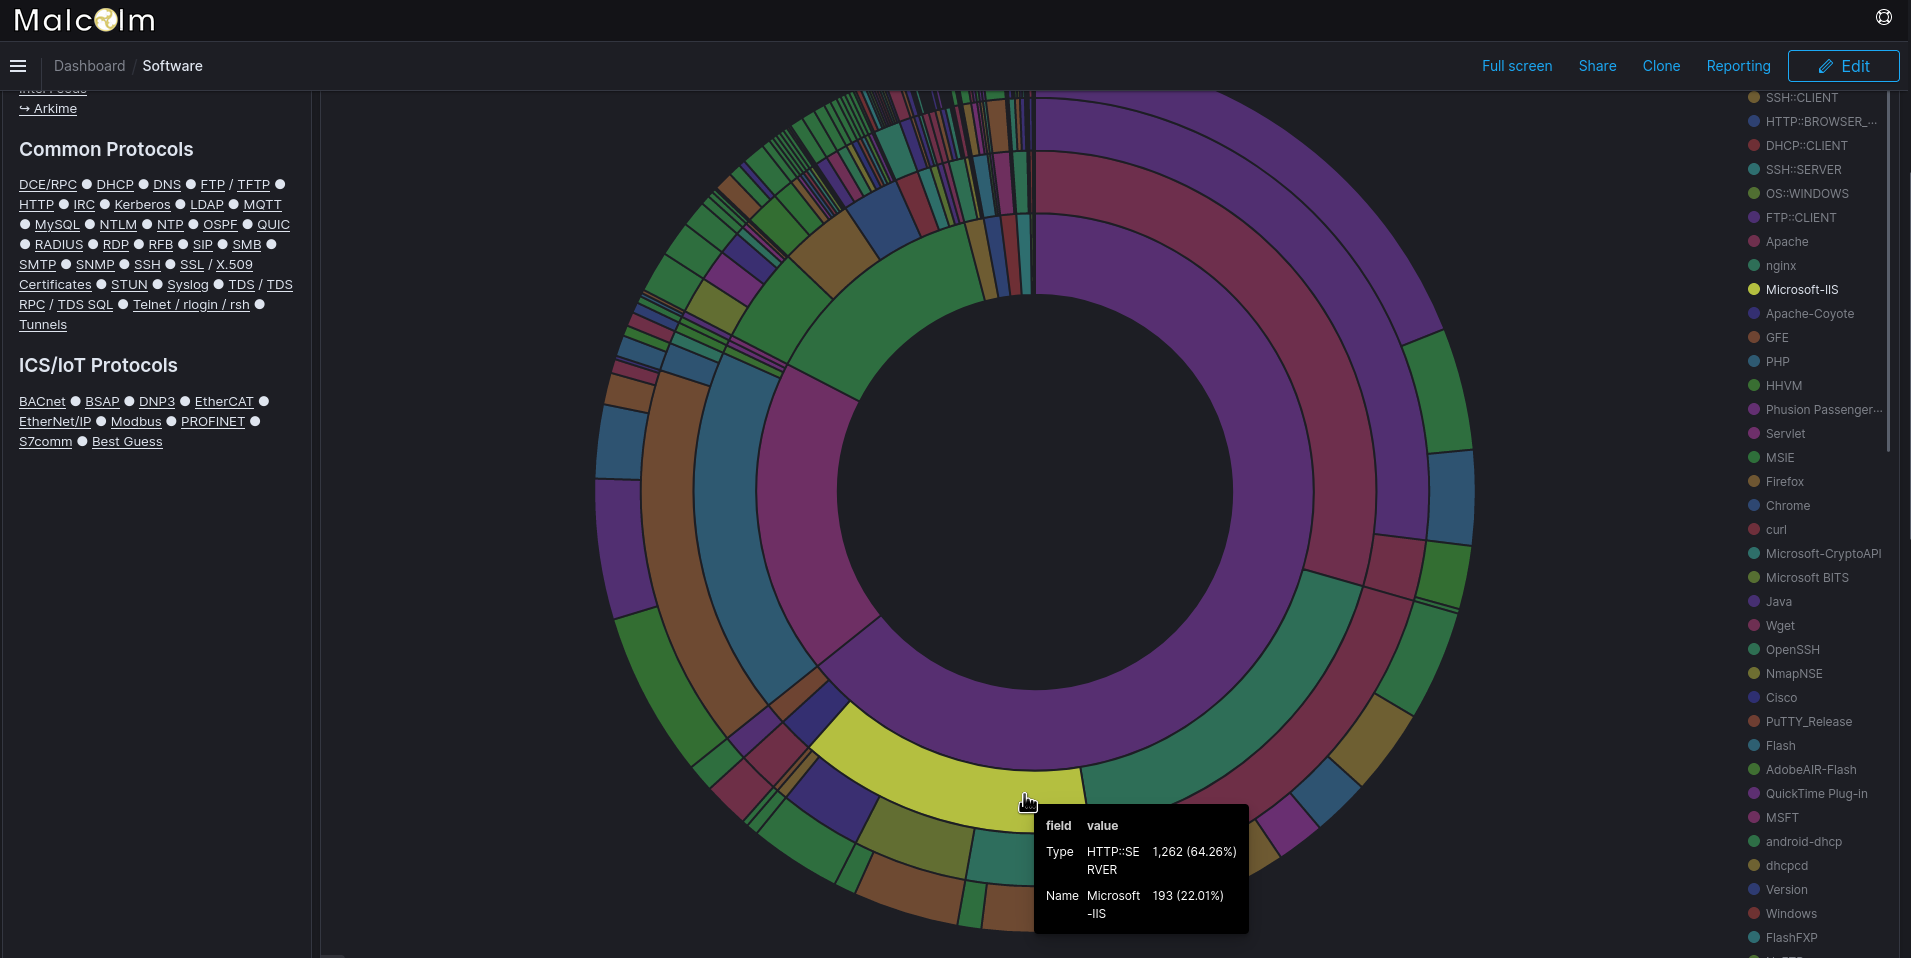
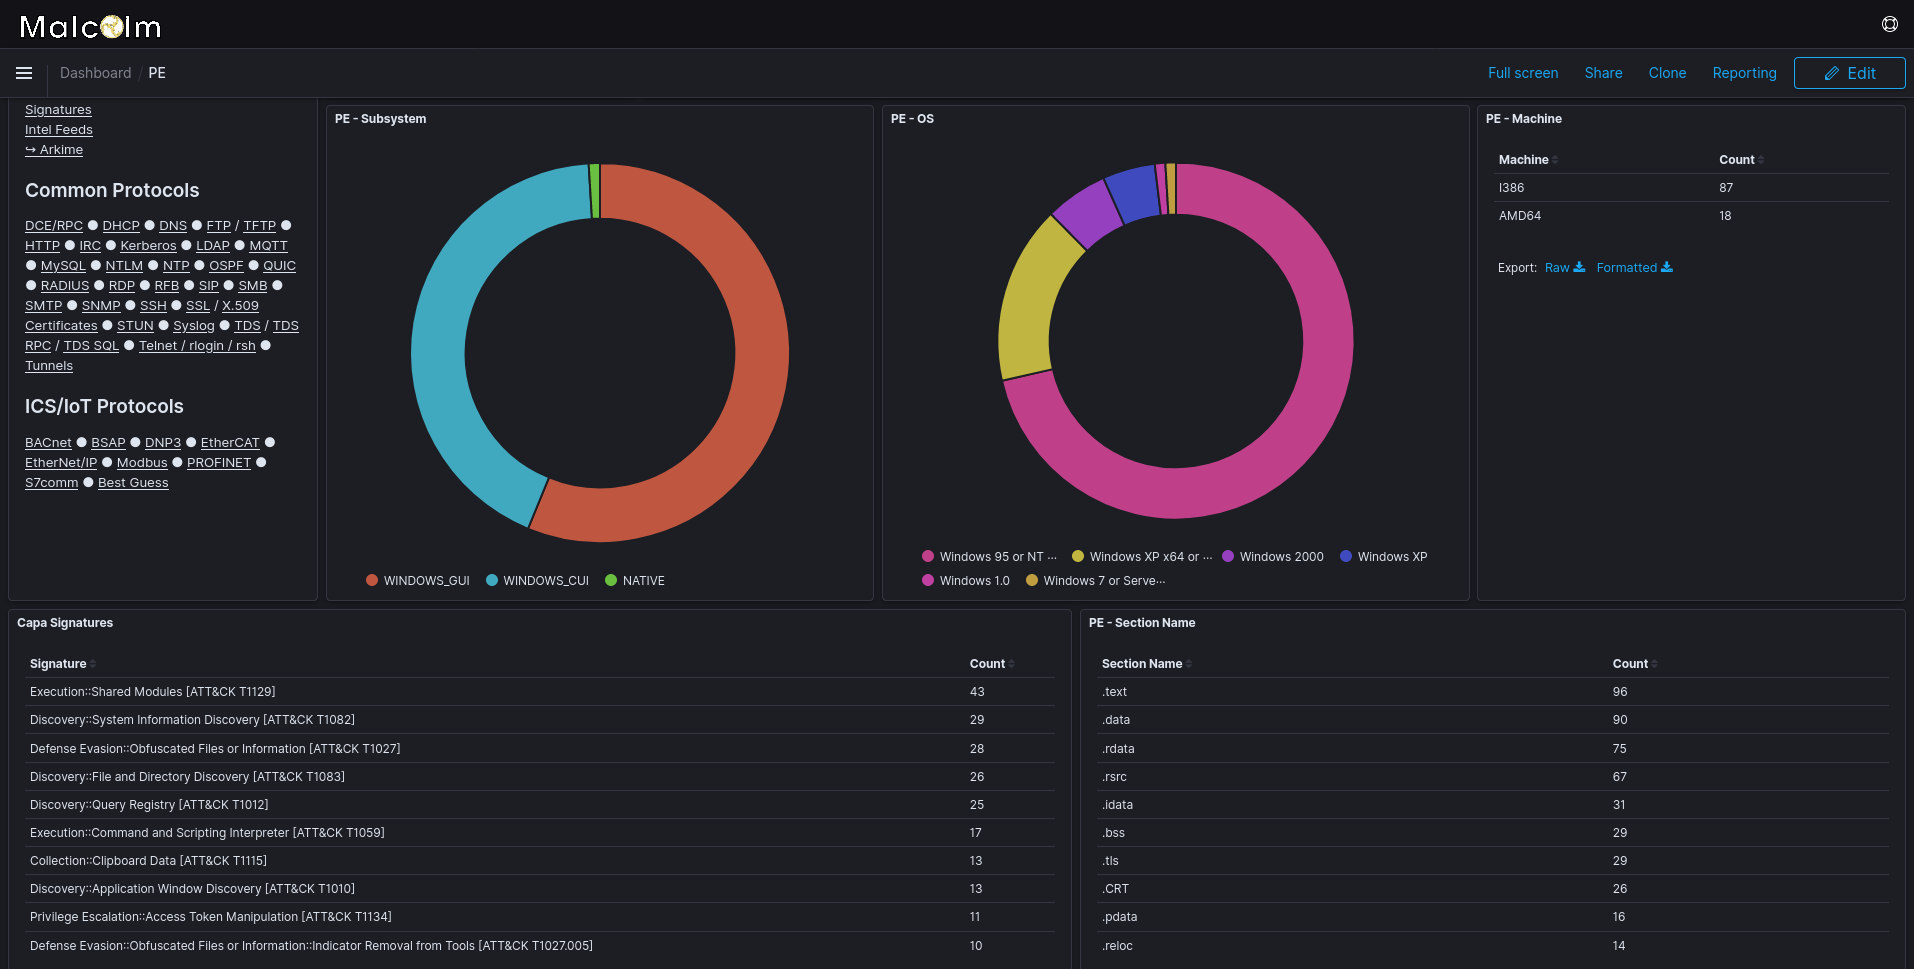
Malcolm comes with dozens of prebuilt visualizations and dashboards for the network traffic represented by each of the Zeek log types. Click Dashboard to see a list of these dashboards. As is the case with all OpenSearch Dashboards visualizations, all of the charts, graphs, maps, and tables are interactive and can be clicked on to narrow or expand the scope of the data under investigation. Similarly, click Visualize to explore the prebuilt visualizations used to build the dashboards.
Inspiration for many of Malcolm’s prebuilt visualizations for Zeek logs was originally drawn from Security Onion’s excellent Kibana dashboards.
Screenshots

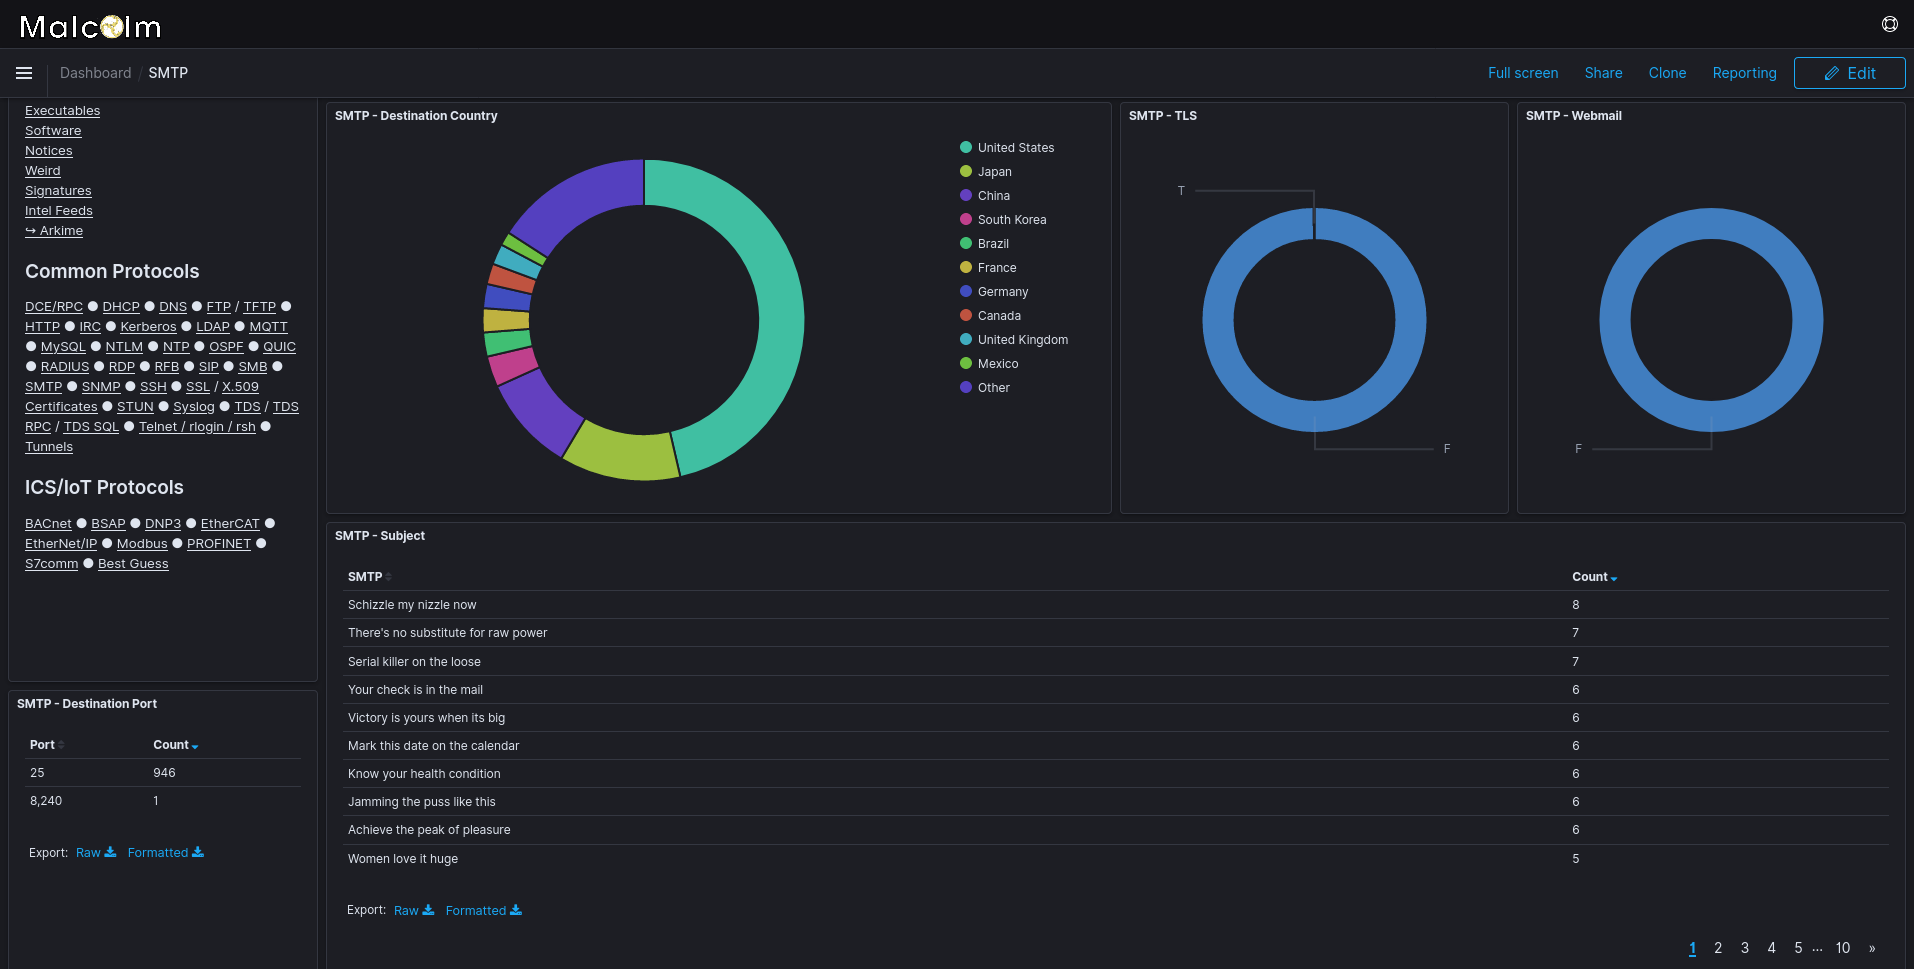
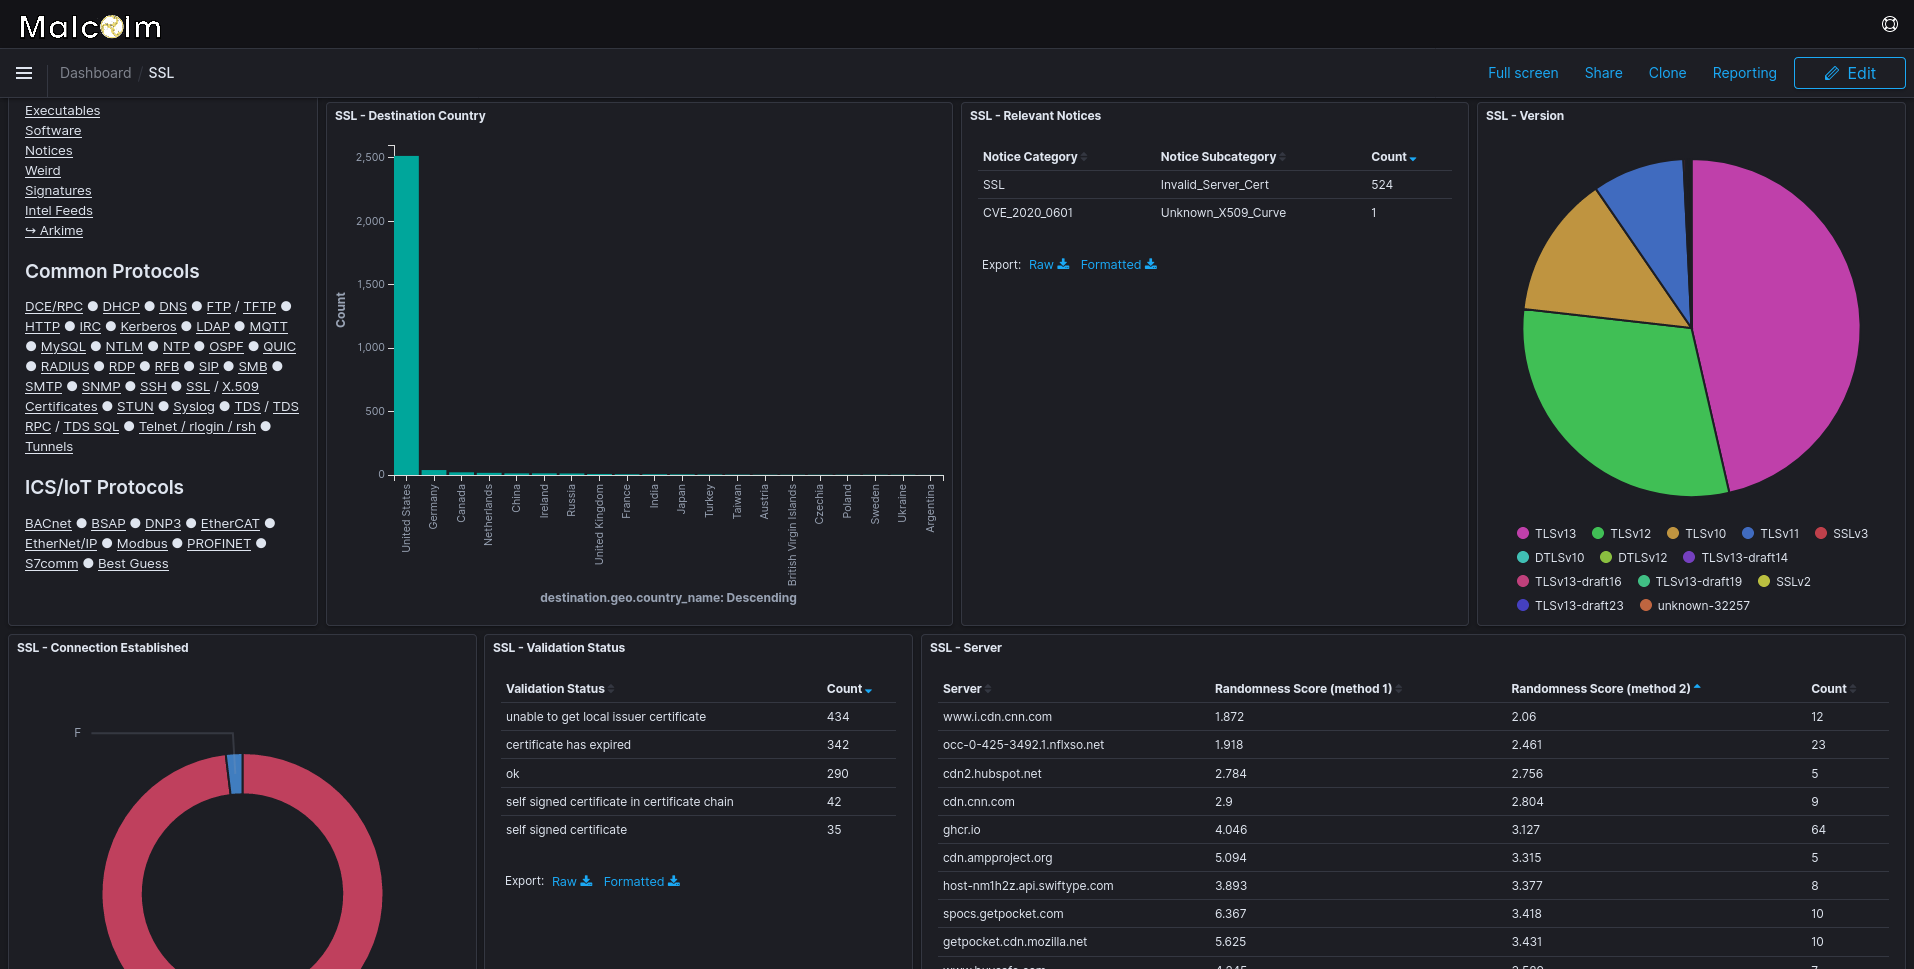
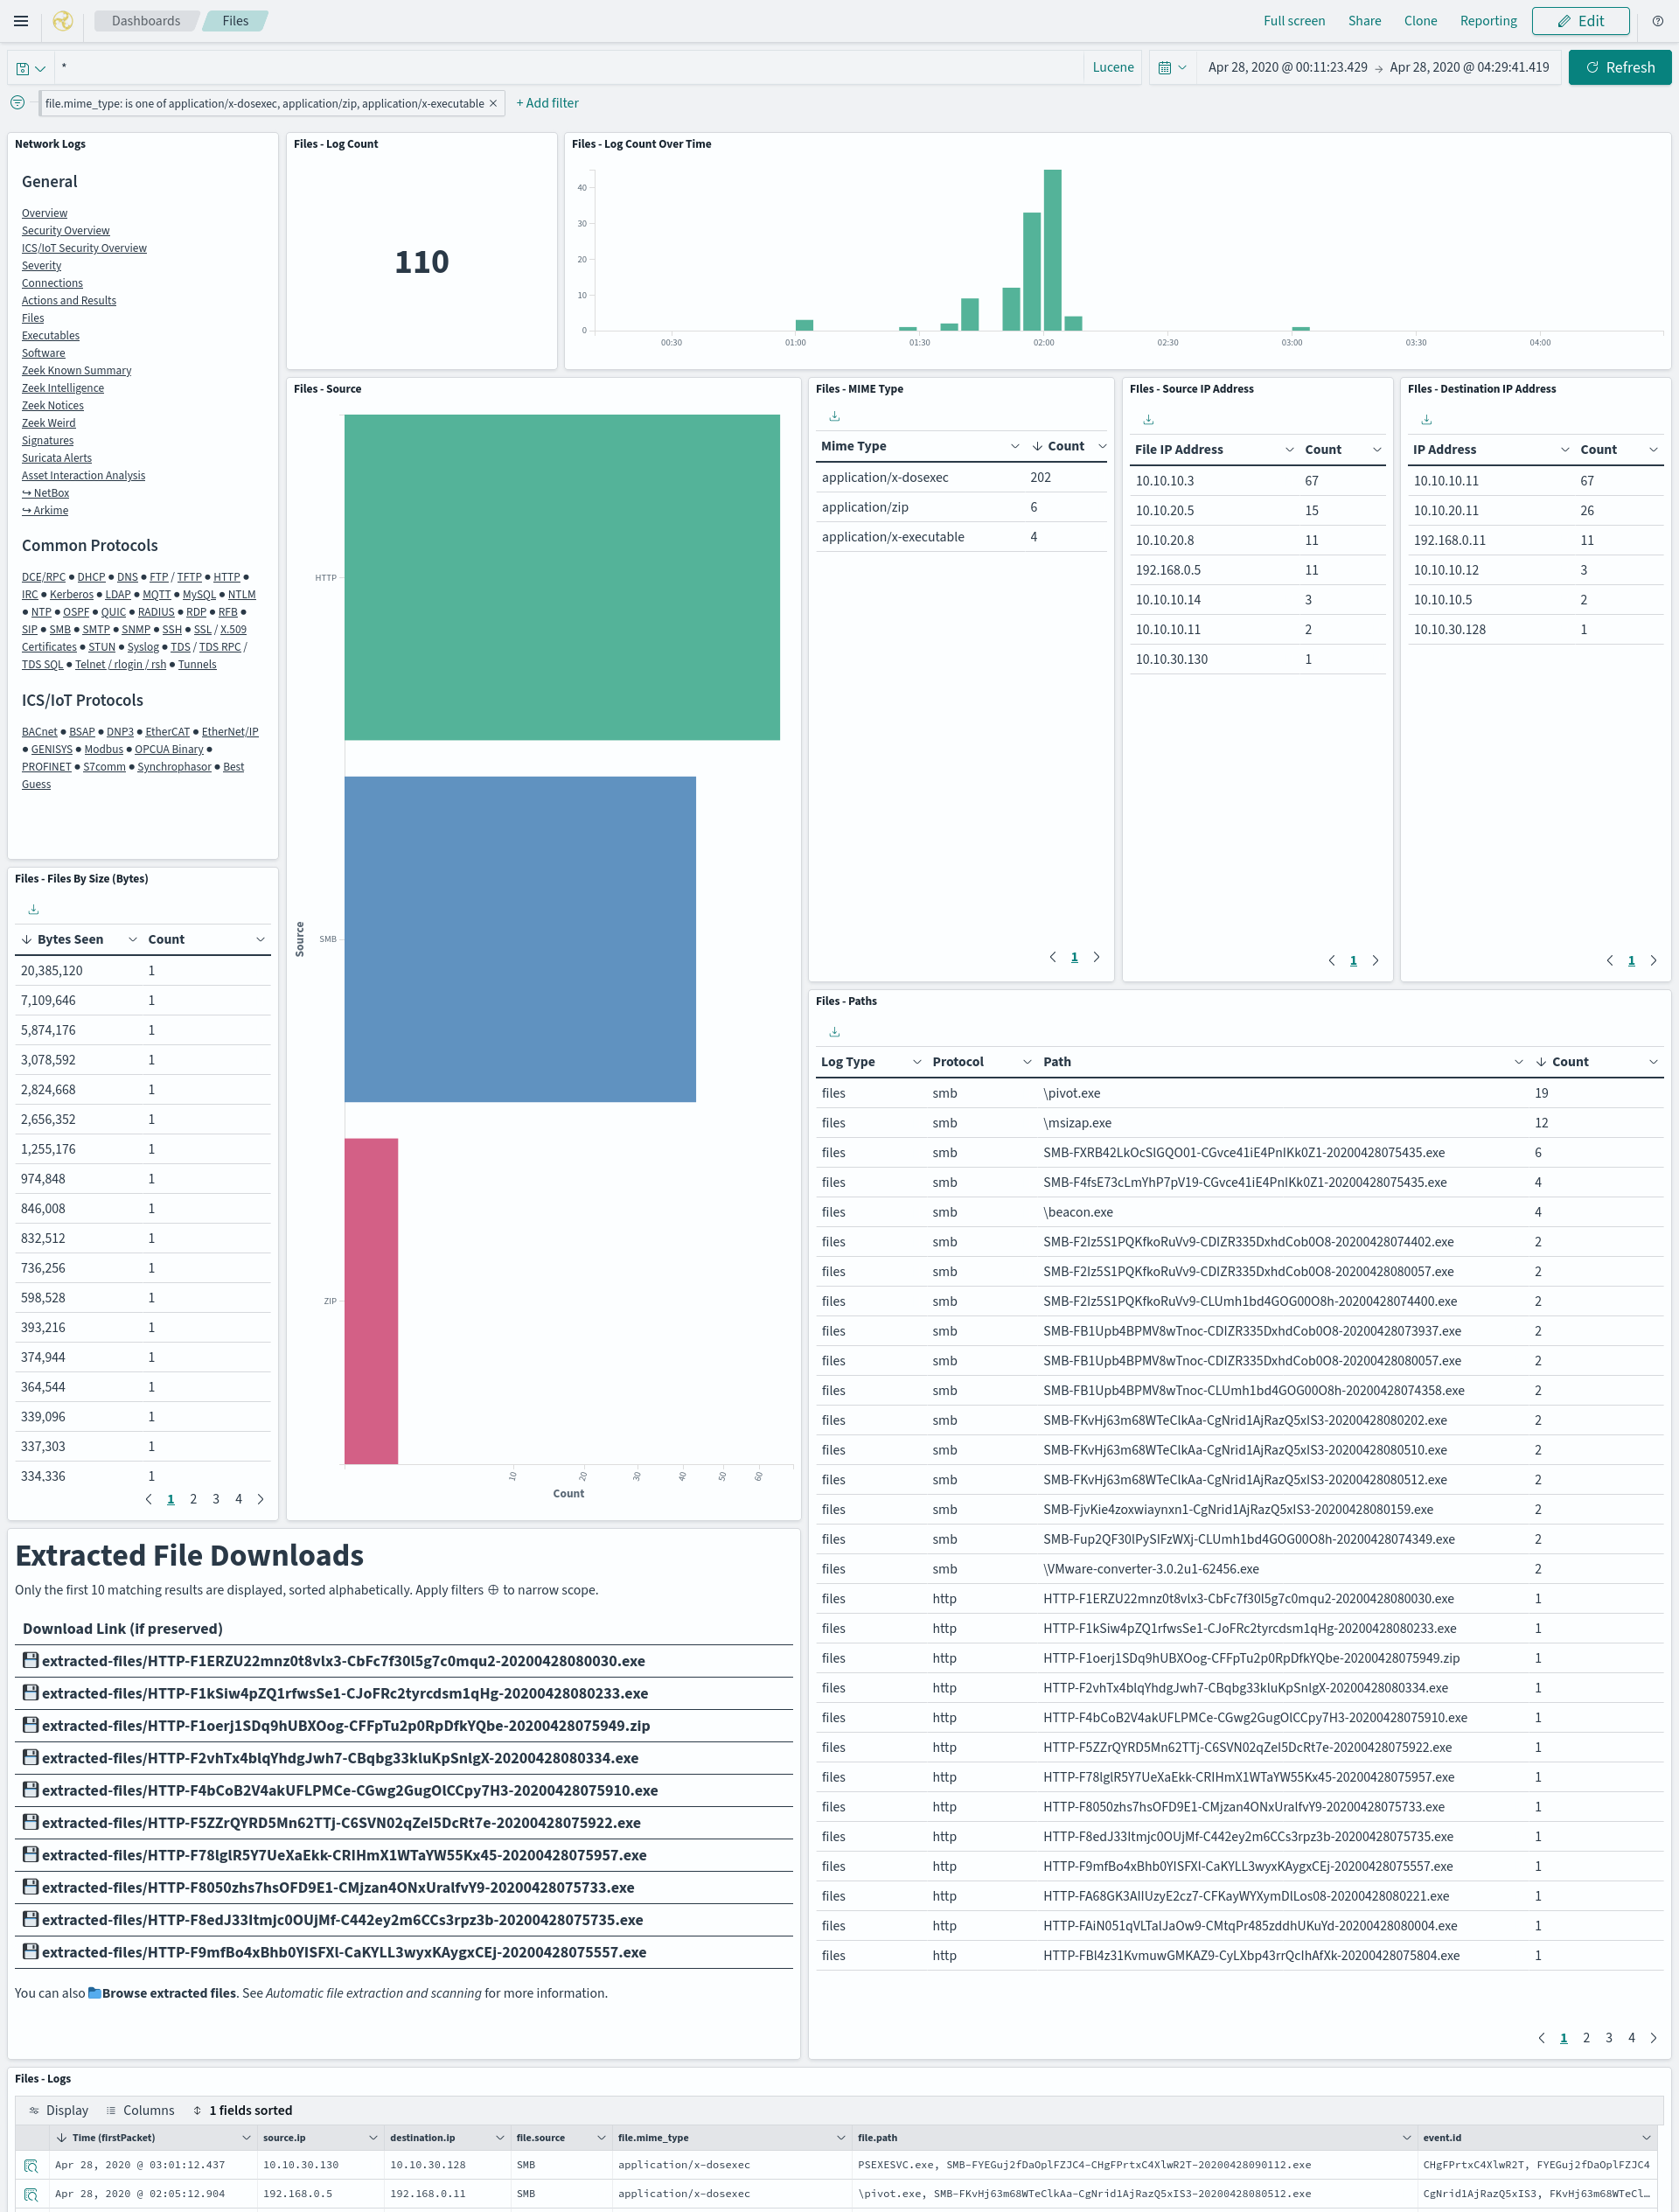
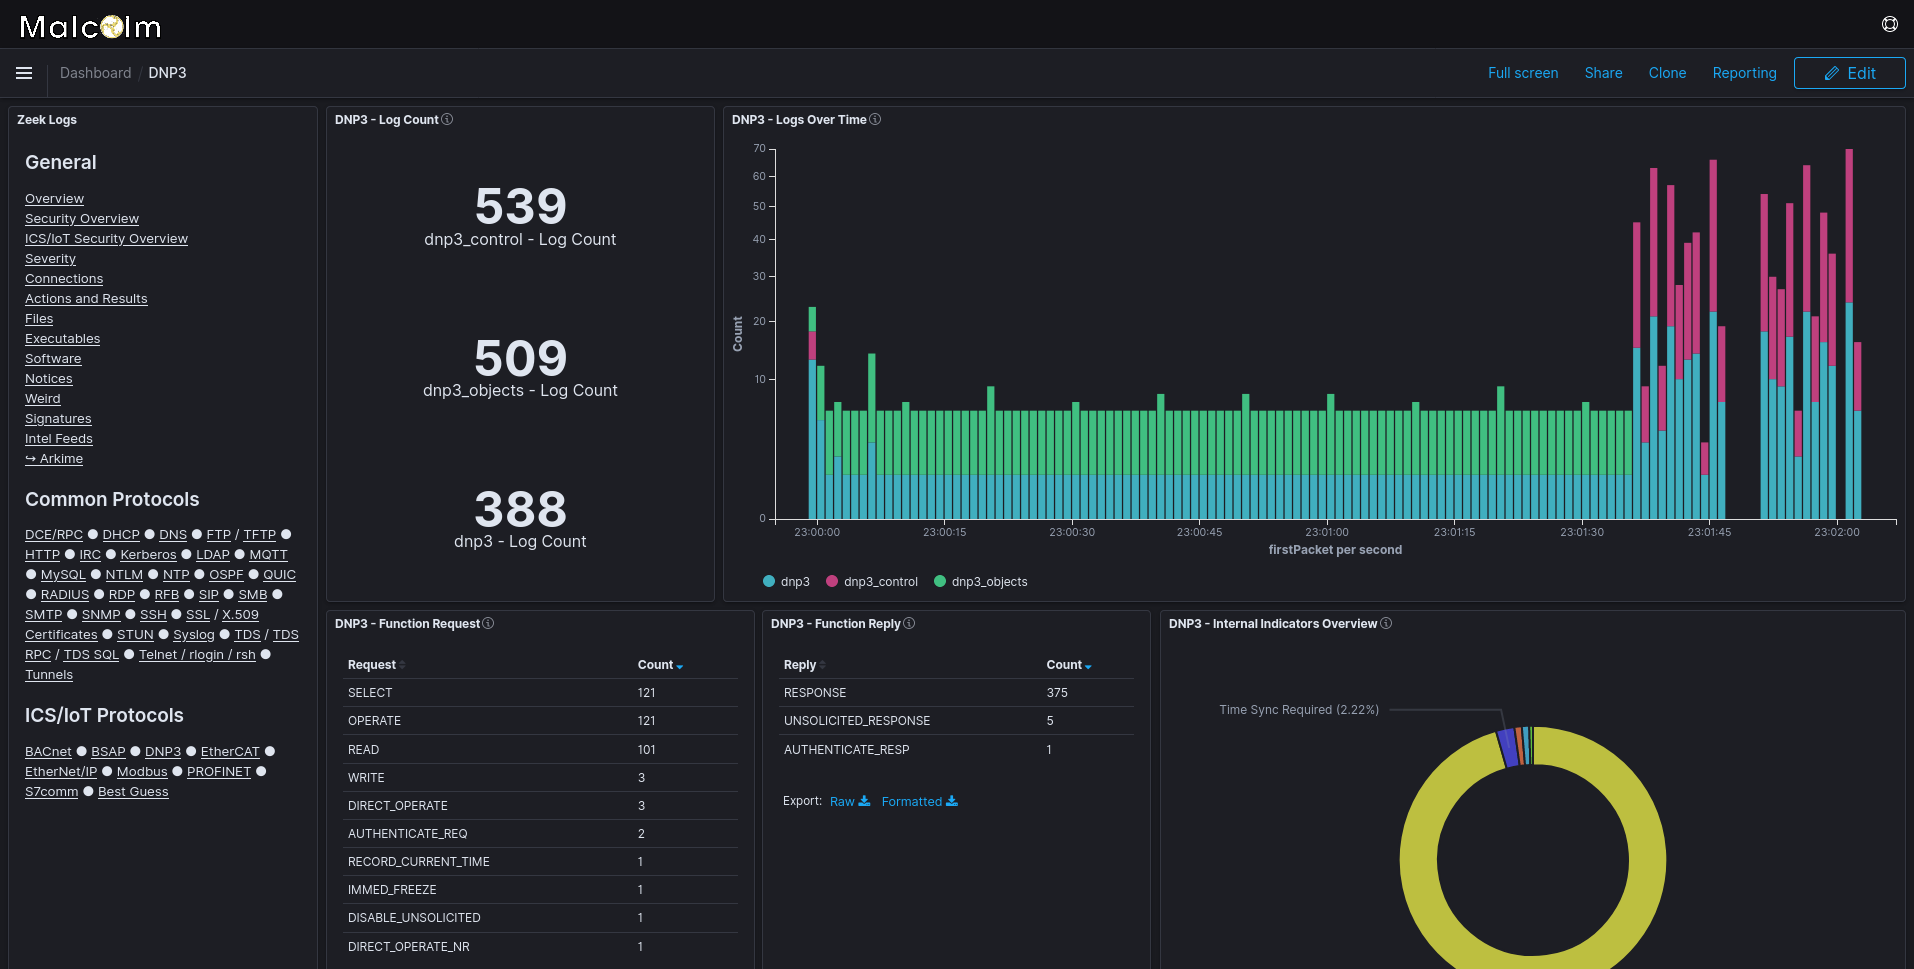
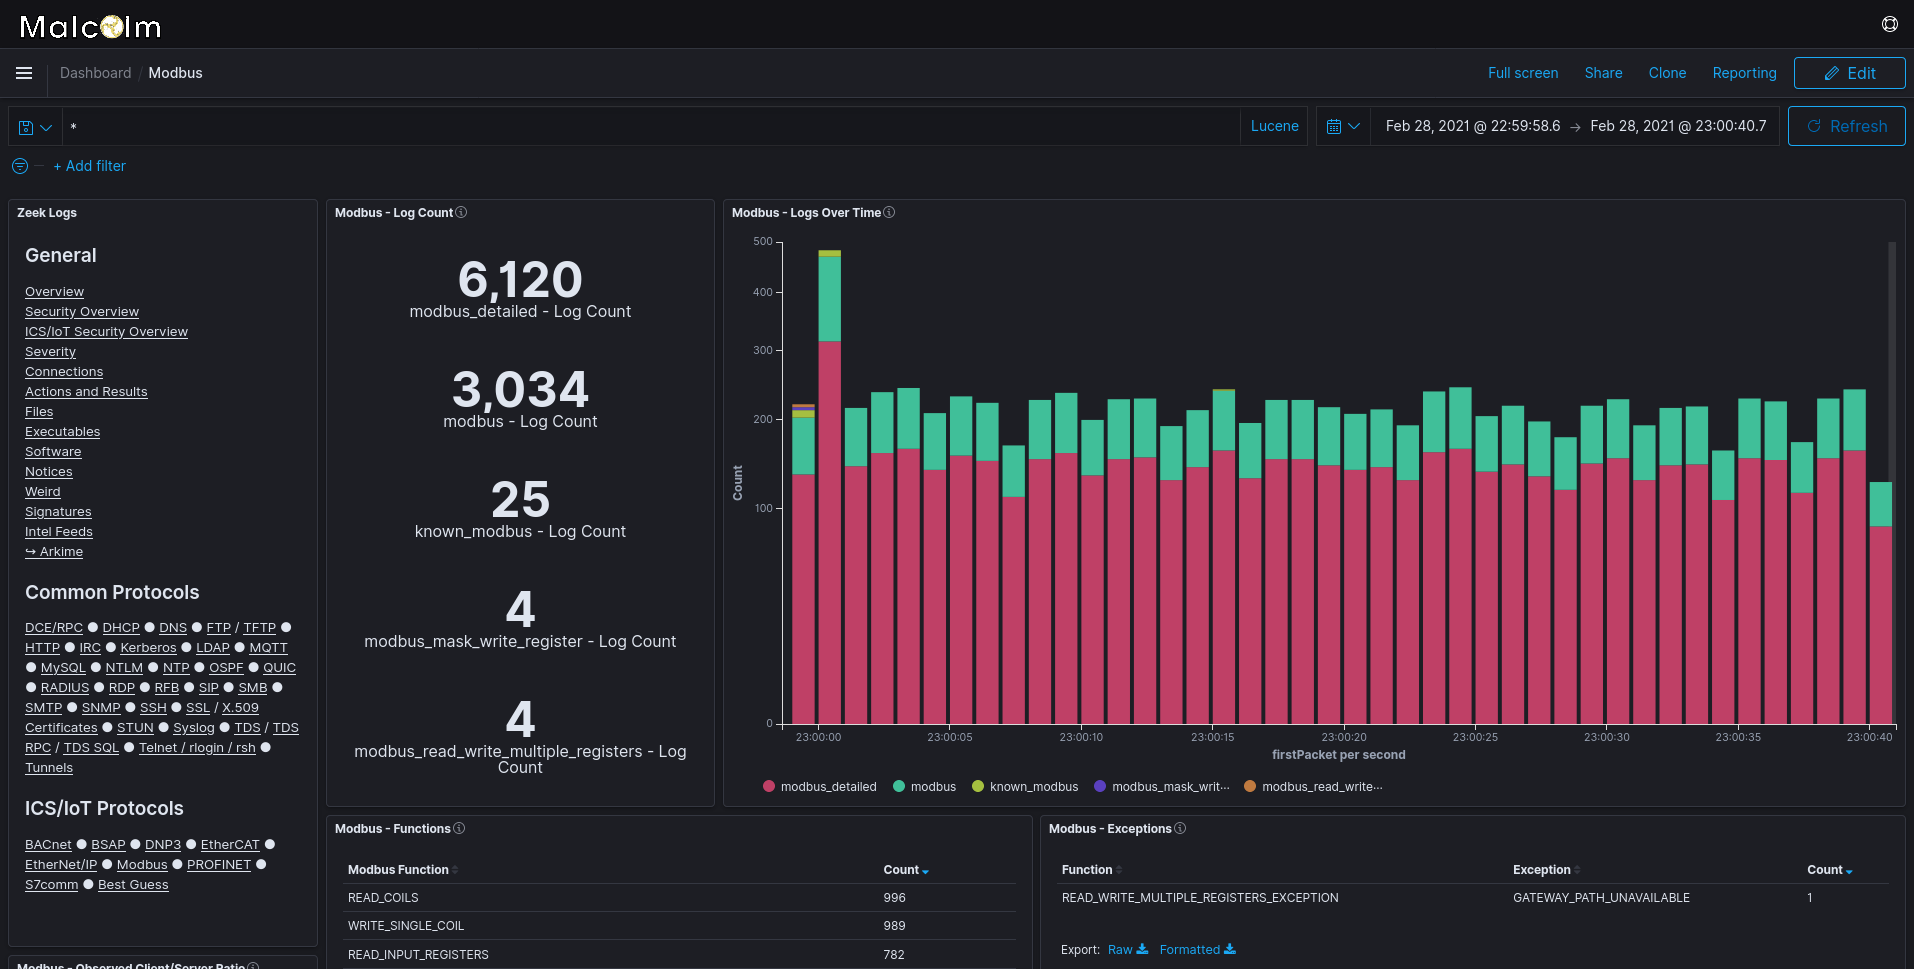
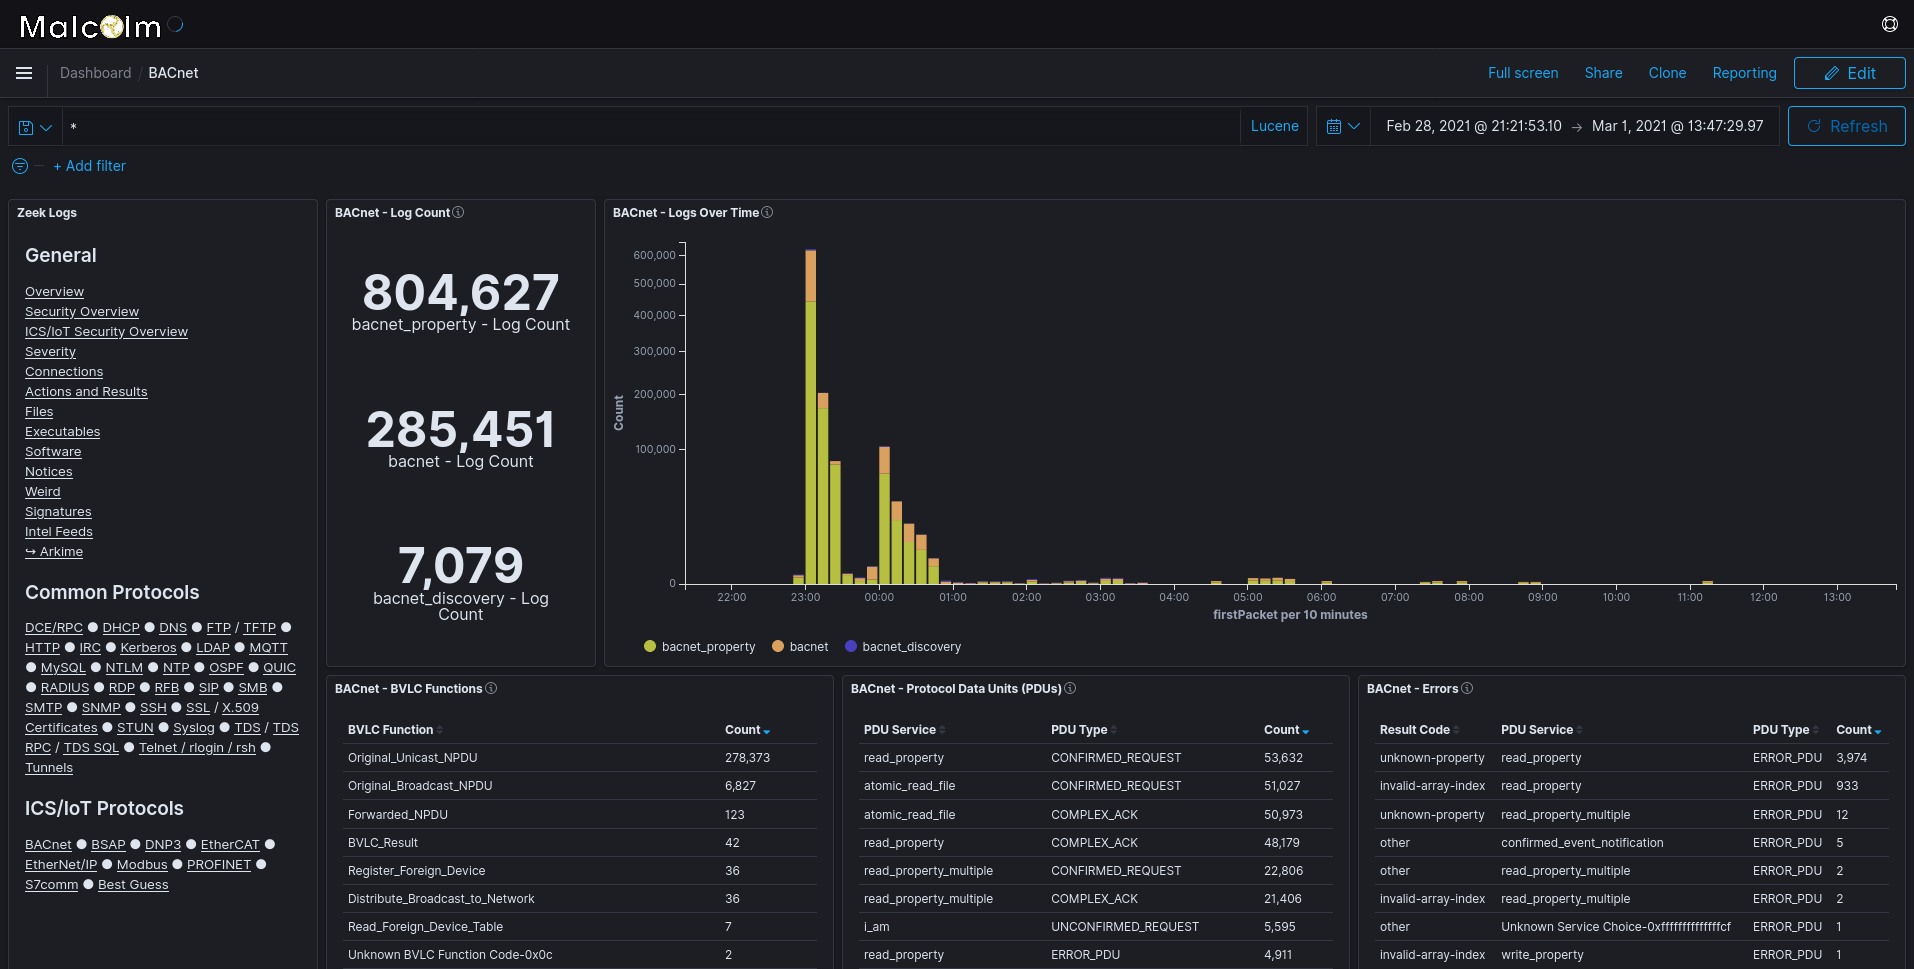
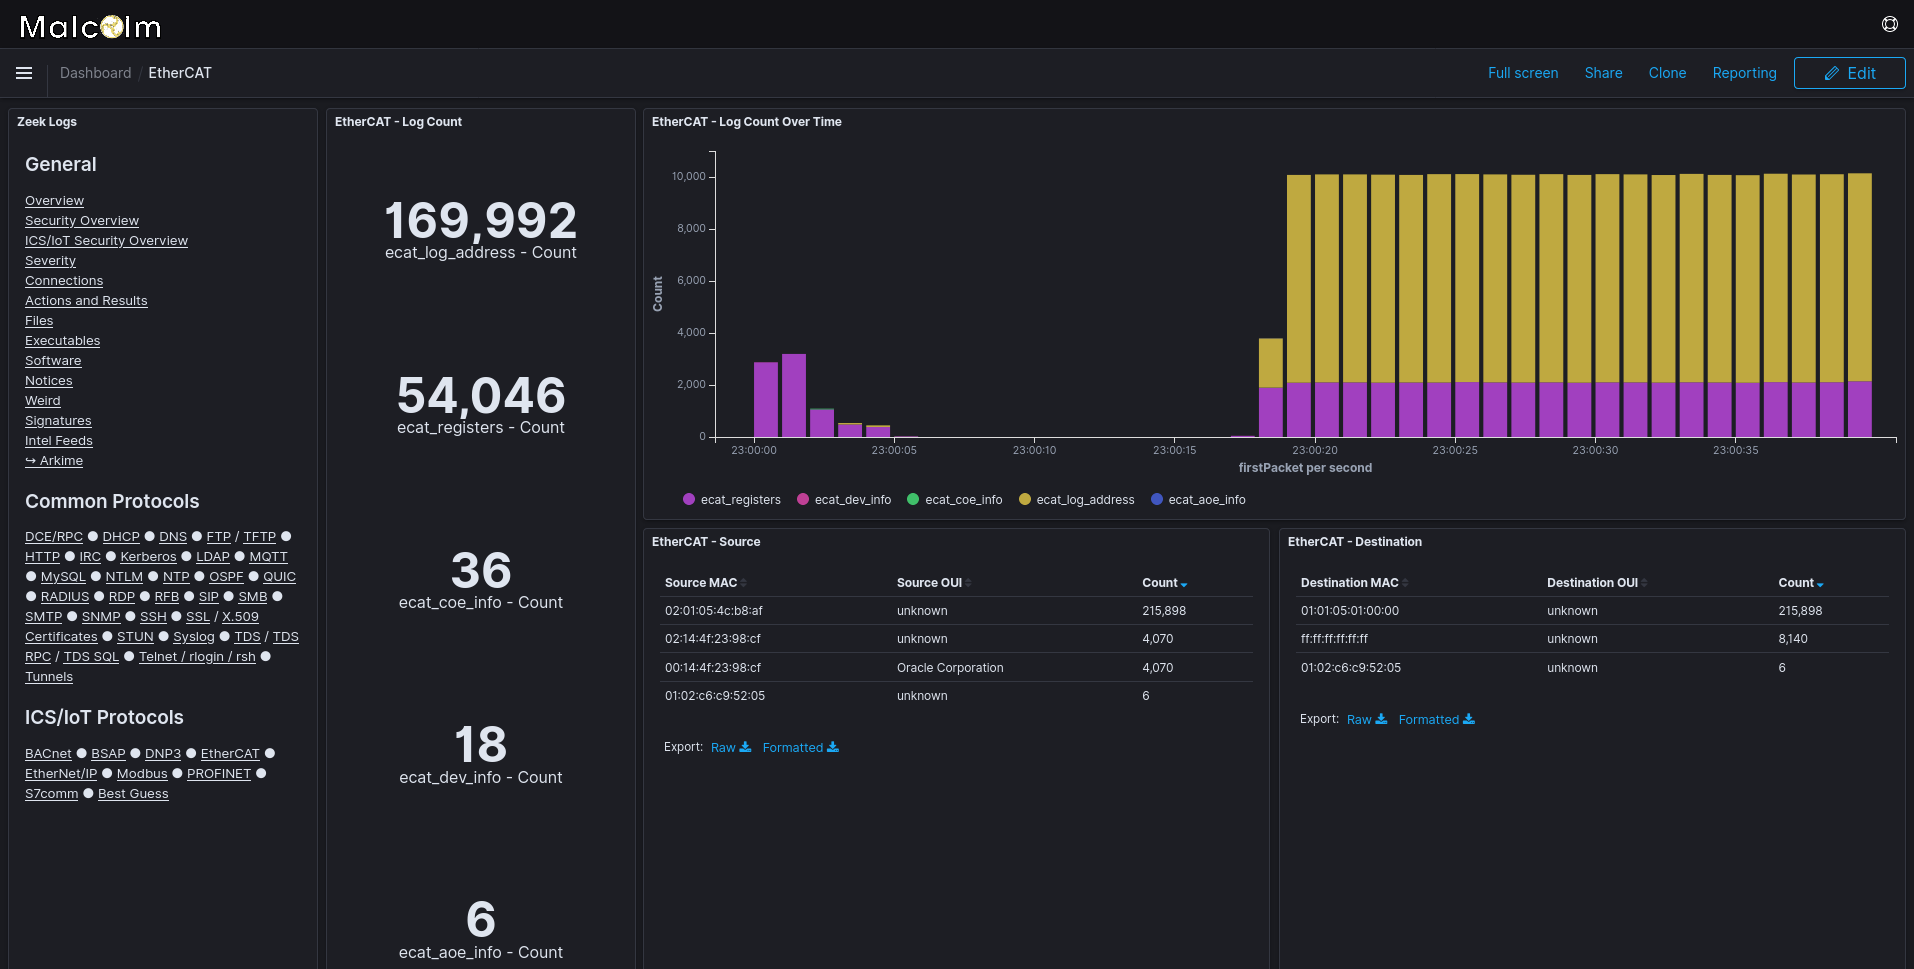
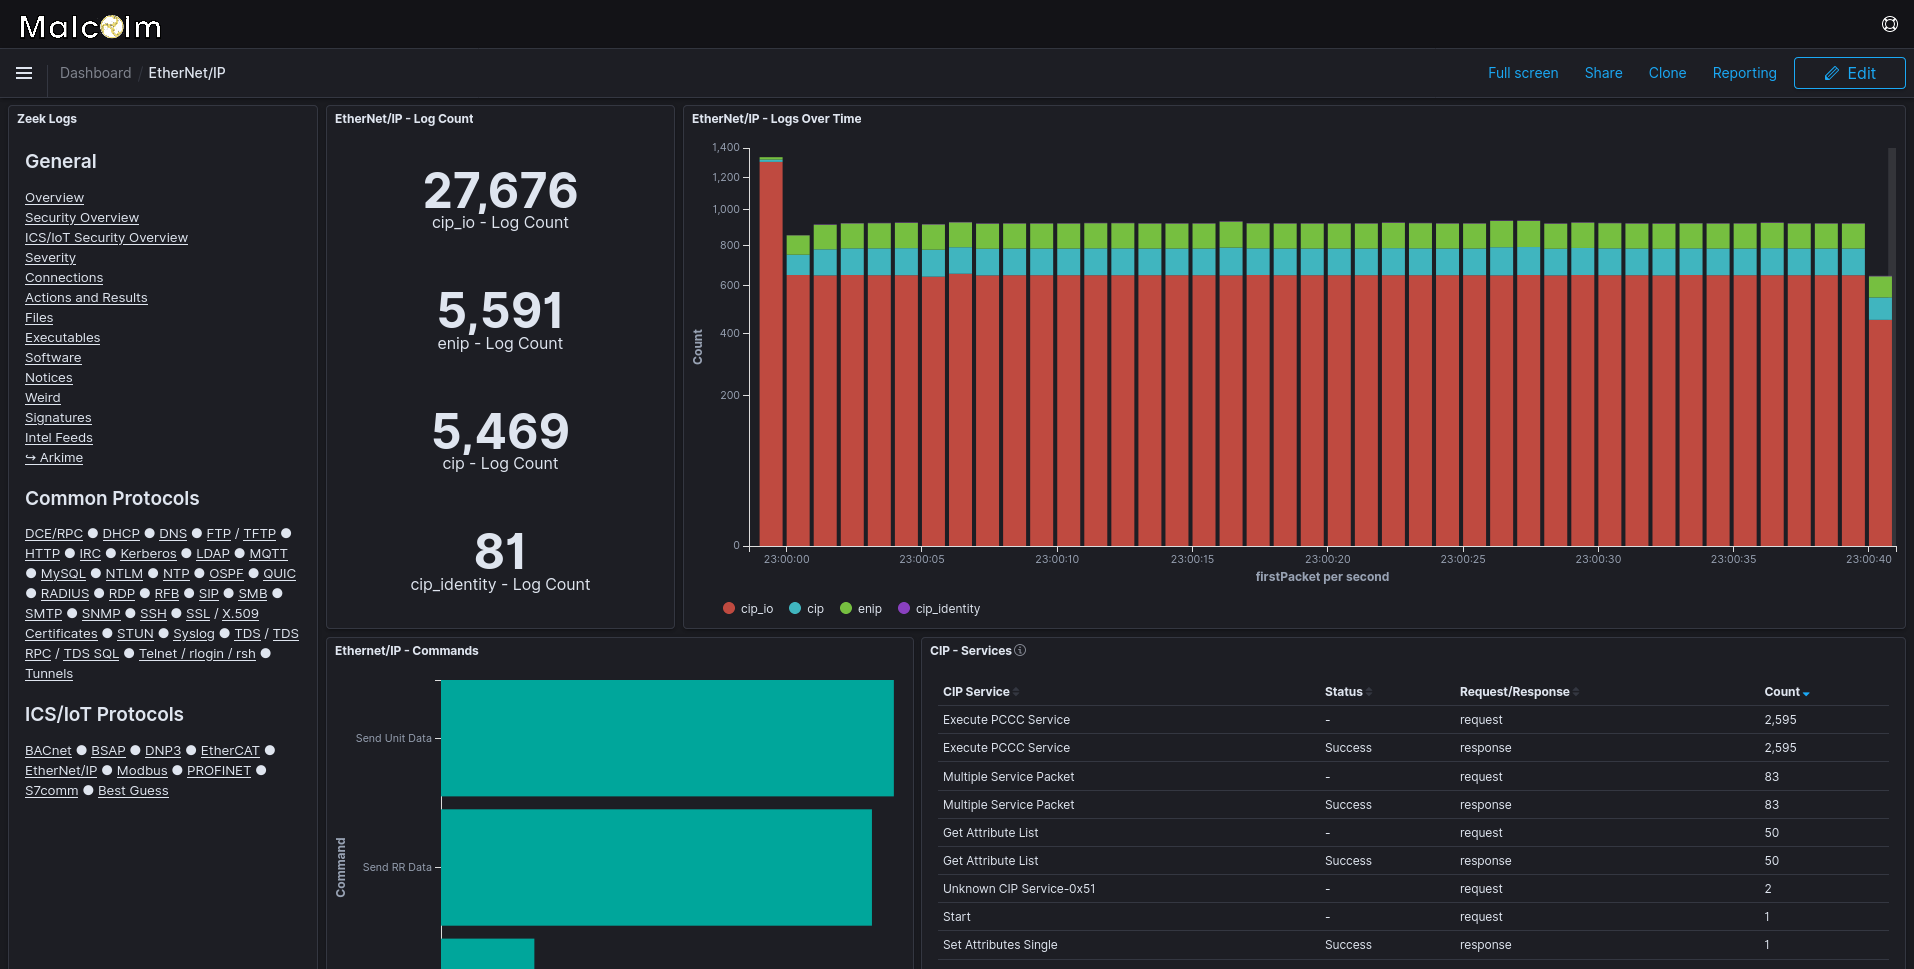
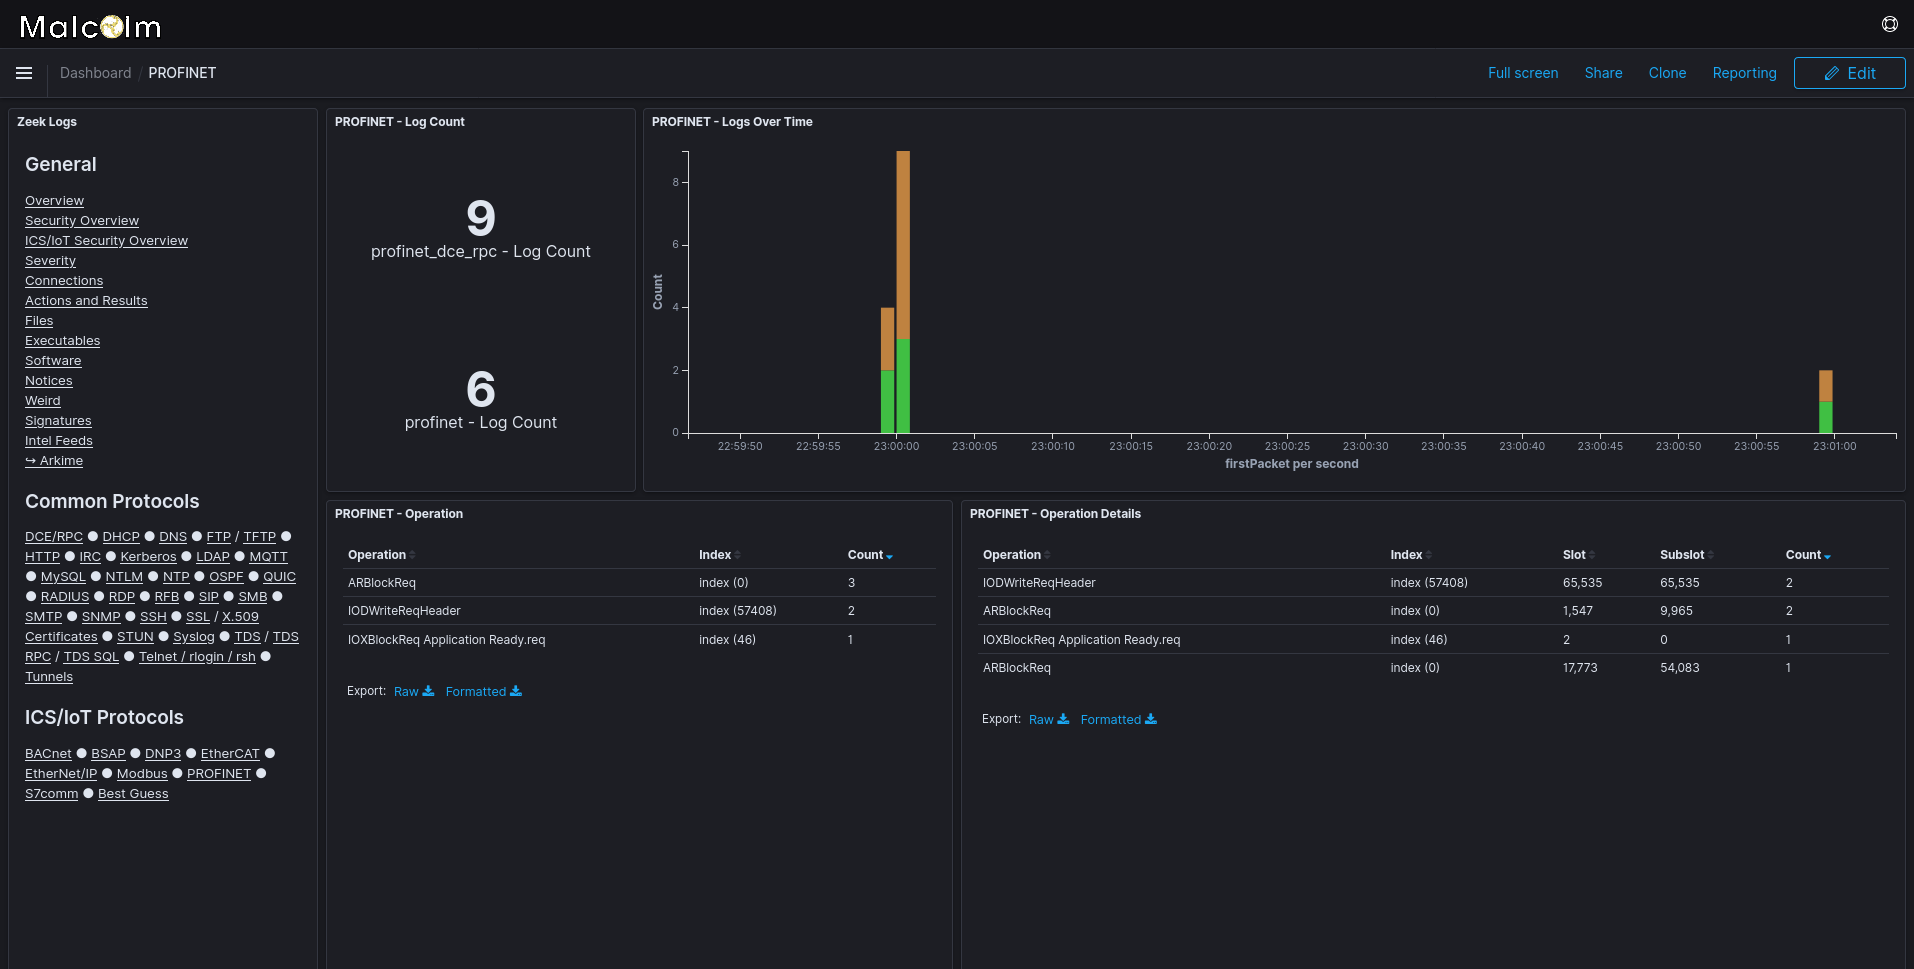
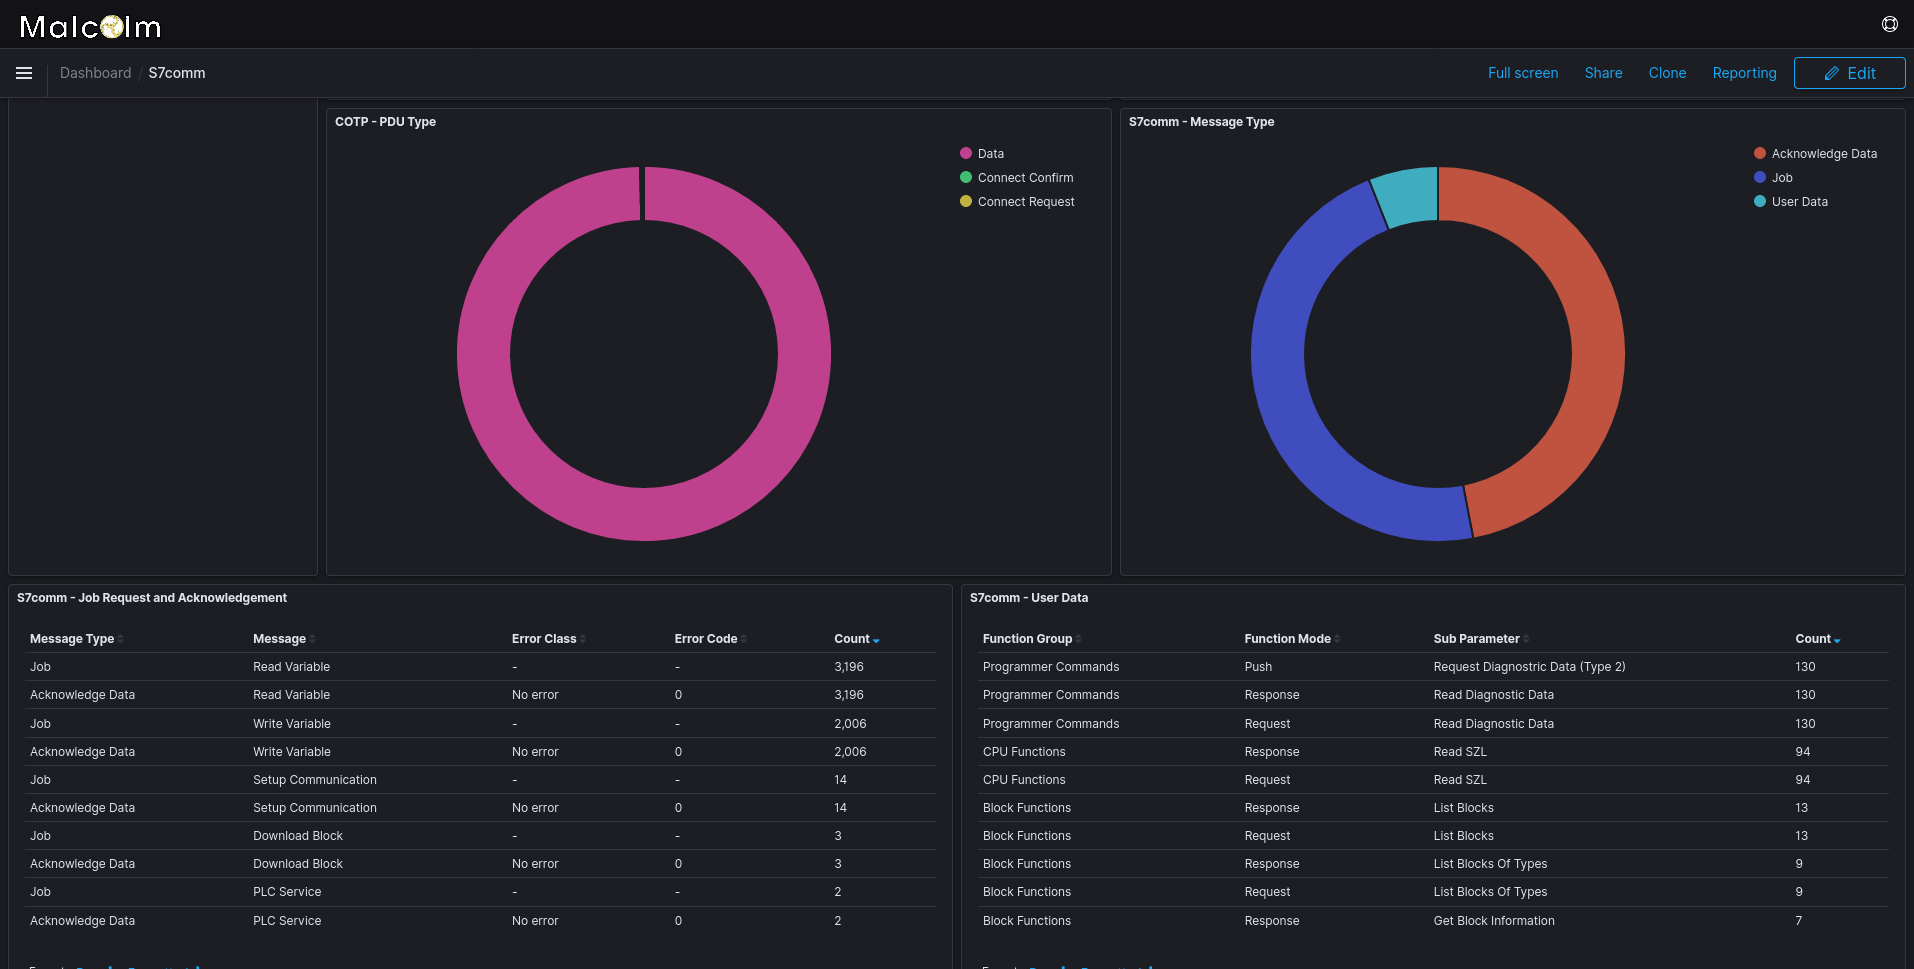
Building visualizations and dashboards
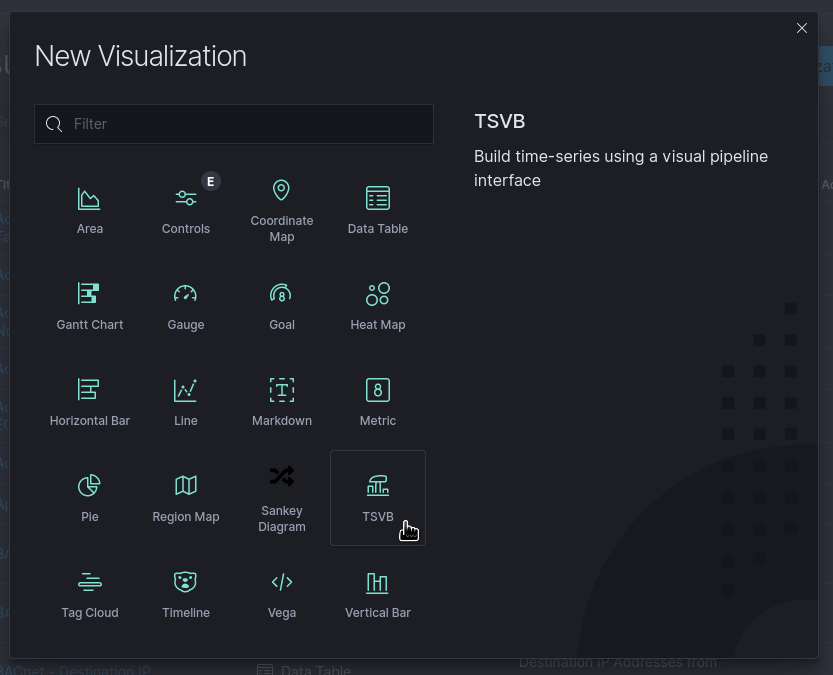
See the official Kibana User Guide and OpenSearch Dashboards (OpenSearch Dashboards is an open-source fork of Kibana, which is no longer open-source software) documentation for information on creating custom visualizations and dashboards:
Screenshots
