A powerful, easily deployable network traffic analysis tool suite for network security monitoring
End-to-end Malcolm and Hedgehog Linux ISO Installation
This document outlines how to install Malcolm and Hedgehog Linux using the project’s installer ISOs. These instructions apply to installing this software both on a “bare metal” system or in a virtual machine environment using VMware, VirtualBox, QEMU/KVM, etc.
The Malcolm and Hedgehog Linux installers as described in these instructions are intended to be used to replace the existing operating system (if any) of the respective systems onto which they are installed; and, as such, are designed to require as little user input as possible. For this reason, there are NO user prompts or confirmations about partitioning and reformatting hard disks for use by the operating system. The installer assumes that all non-removable storage media (eg., SSD, HDD, NVMe, etc.) are available for use and ⛔🆘😭💀 will partition and format them without warning 💀😭🆘⛔.
In contrast to using the ISO installer, Malcolm can also be installed on any x86-64 (also known as x64, x86_64, AMD64, and Intel 64) or AArch64 (also known as ARM64) platform capable of running Docker or Podman. See the installation example using Ubuntu 24.04 LTS for that method of installation and configuration, or Windows host system configuration and macOS host system configuration for those platforms.
Table of Contents
- Obtaining the Installation ISOs
- “Burning” the Installation ISOs to USB Flash Drive
- Booting the Installation Media
- Malcolm Installation and Configuration
- Hedgehog Linux Installation and Configuration
- Verifying Traffic Capture and Forwarding
- Tuning Live Analysis
Obtaining the Installation ISOs
Please see Downloading Malcolm for instructions on how to obtain the Malcolm and Hedgehog Linux installation ISOs.
As an alternative to the official release ISOs, instructions are provided for building the Malcolm installer ISO and Hedgehog Linux installer ISO (Malcolm’s dedicated network sensor appliance OS) from scratch.
“Burning” the Installation ISOs to USB Flash Drive
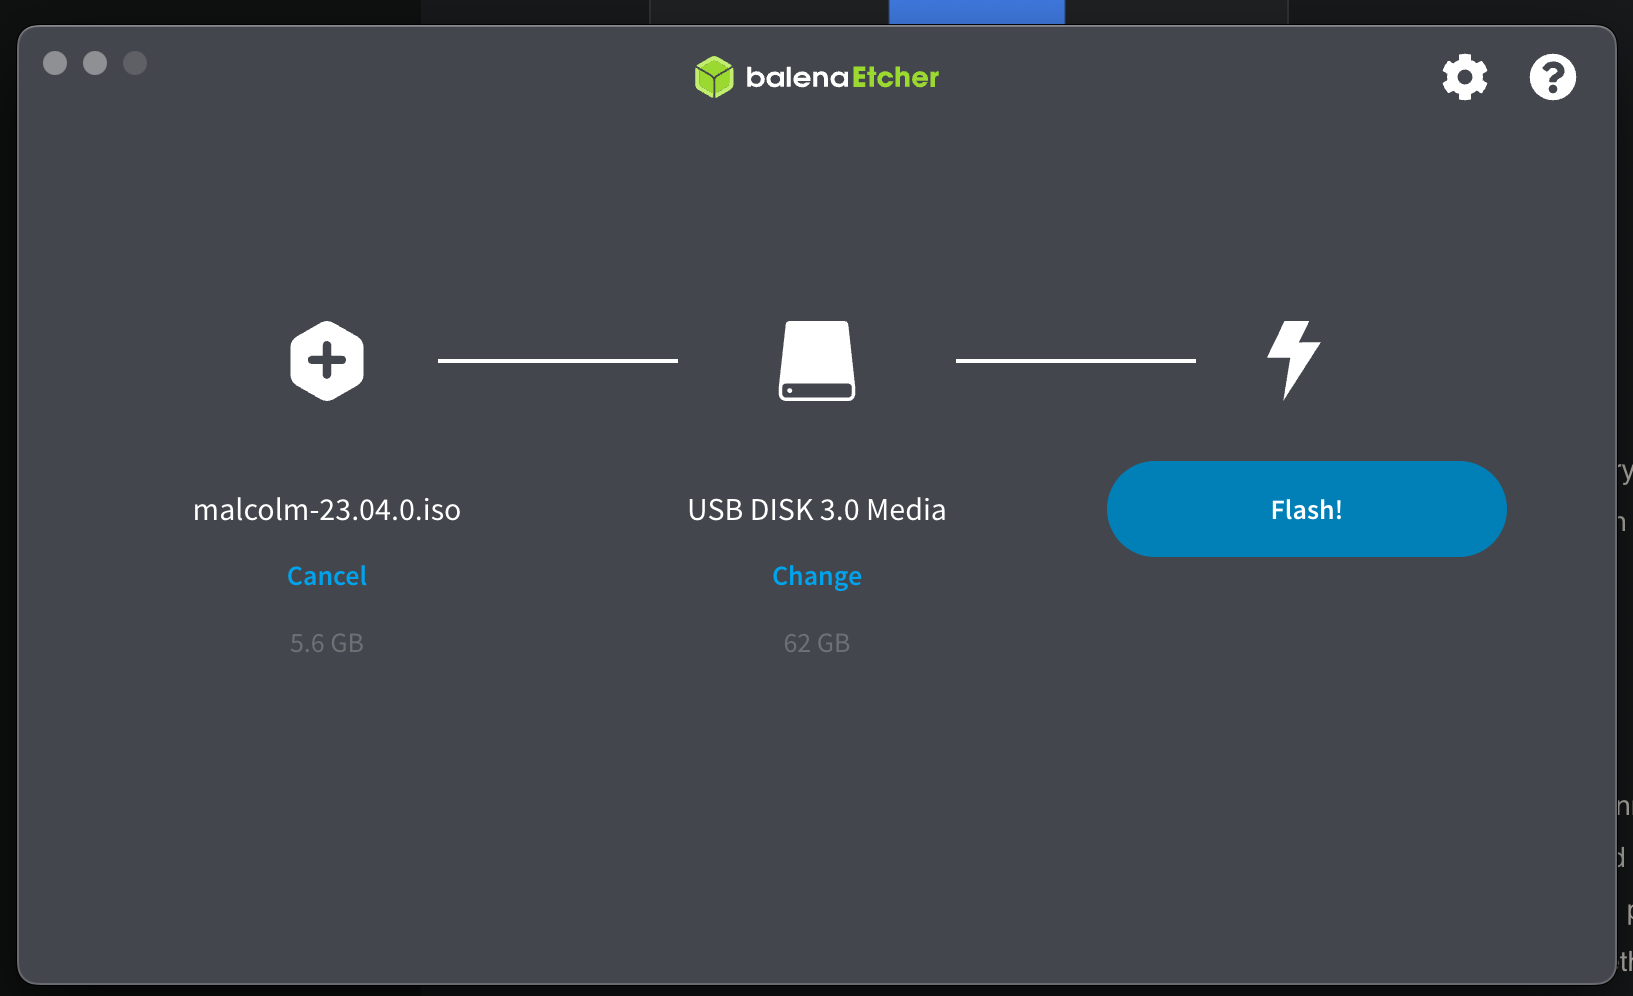
Various methods can be used to write the contents of an installer ISO image to a USB flash drive. One simple free and open-source application for doing so is Etcher, which can be used on Windows, macOS, and Linux platforms.
Alternatively, instructions specific to a particular operating system may be found online (e.g., Arch Linux, Debian Linux, Ubuntu Linux).
Using one of these methods, write the Malcolm and Hedgehog Linux installer ISOs to two 8GB or larger USB flash drives, respectively.
Alternatively, the ISO images could be burned to writable optical media (e.g., DVD±R). The Malcolm installer will likely need to be written to DVD±R DL (“dual layer” or “double layer”) media as the image exceeds the 4.7 GB storage provided by standard DVDs.
Using Etcher on macOS
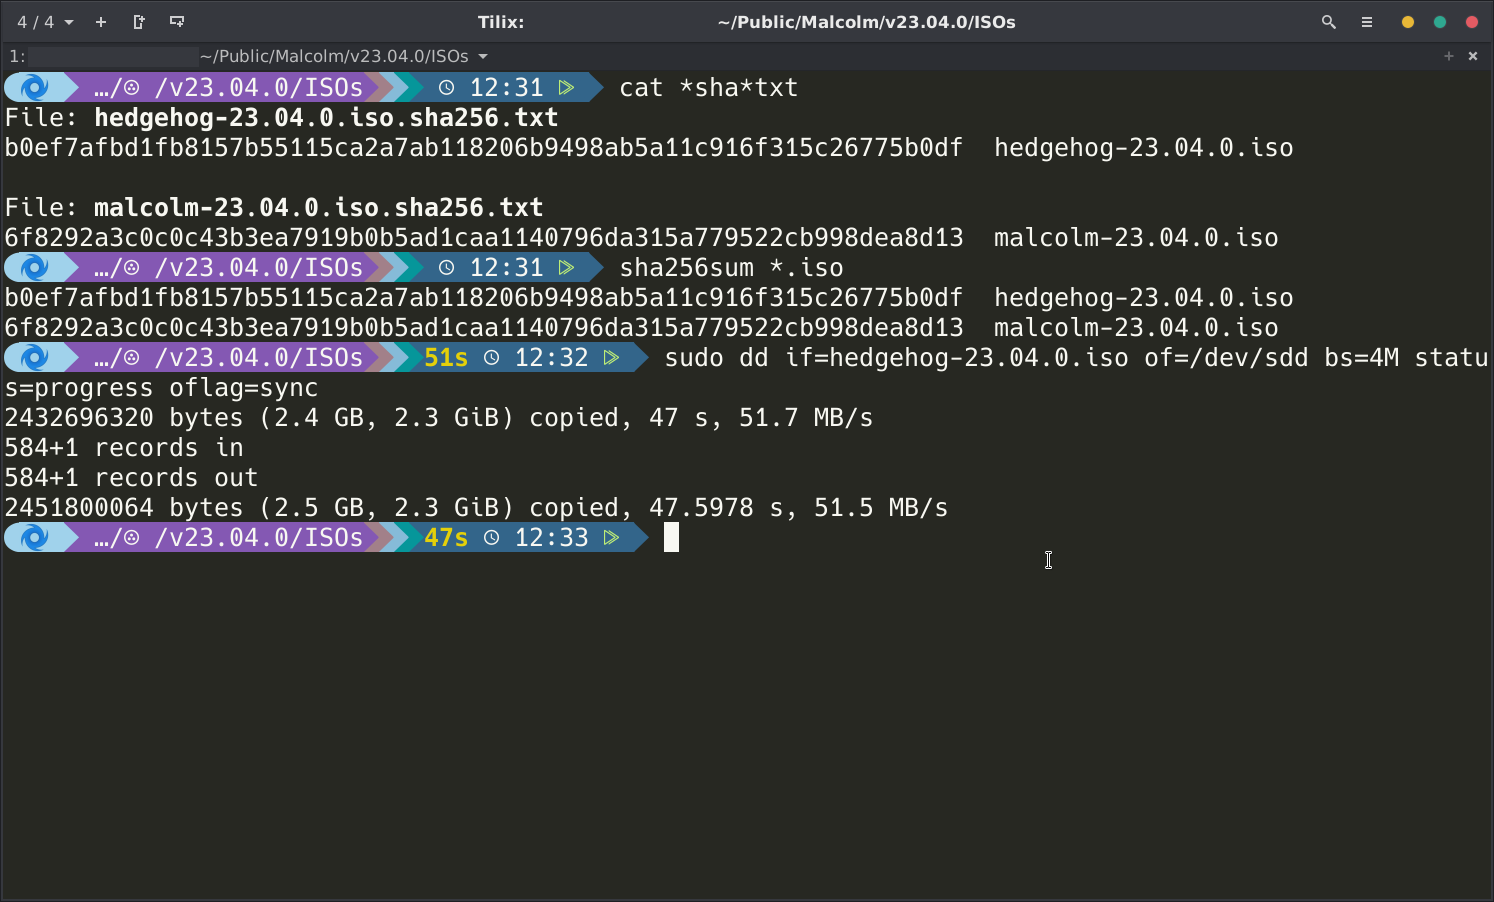
Using dd on Linux
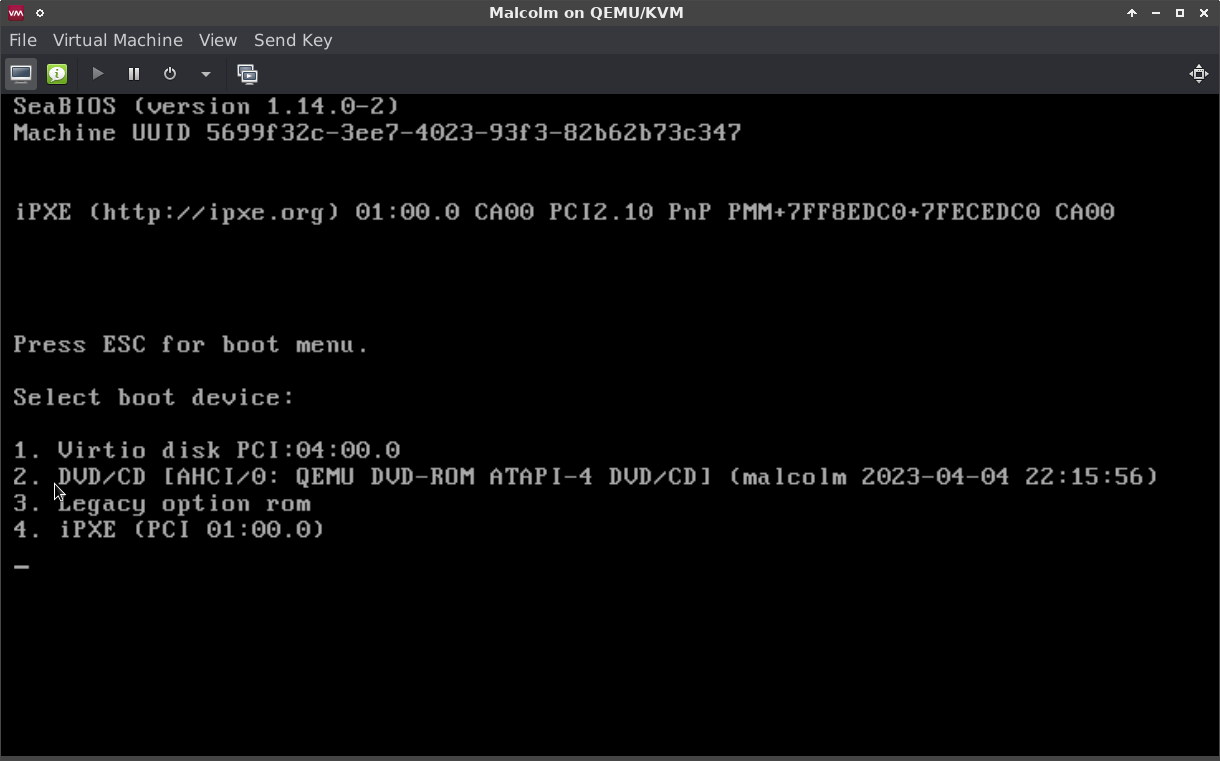
Booting the Installation Media
The ISO installers are compatible with systems that support EFI-mode and legacy (BIOS) booting. The procedure for configuring a system’s firmware to allow booting from USB or optical media varies from manufacturer to manufacturer. Manufacturers typically provide a “one-time boot” menu upon a specific keypress (e.g., F12 for Dell, F9 for HP, etc.). If needed, consult the documentation provided by the hardware manufacturer on how to access the boot options menu and boot from the newly-burned USB flash media or DVD±R.
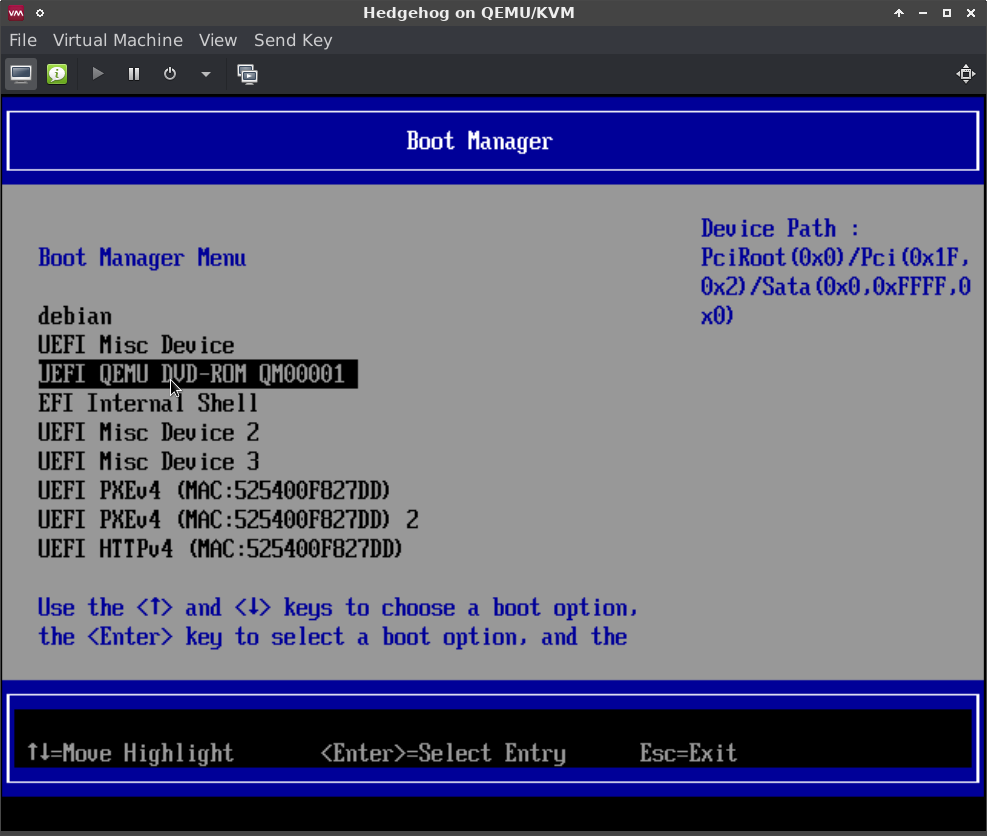
An example of an EFI boot manager in QEMU
An example of a BIOS boot options menu in QEMU
Malcolm Installation and Configuration
ISO Installation
Upon Booting the Malcolm installation ISO, users are presented with the following Boot menu. Use the arrow keys to select Install Malcolm, and press Enter.
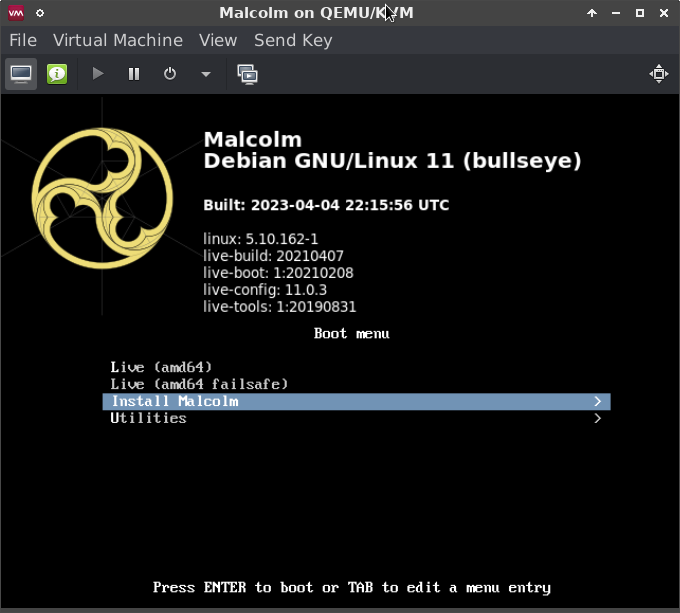
The first screen of the installer
The next screen of the installer presents the following options relevant to installation:
- Quick Install - Installs Malcolm without full disk encryption using default partitioning.
- Quick Install (no LVM) - The same as Quick Install, only does not use Logical Volume Management (LVM) framework.
- Encrypted Quick Install - Installs Malcolm with full disk encryption using default partitioning. Users will be prompted for a password for full disk encryption during installation which must be entered each time the system boots.
- Expert Install - Allows users to configure the options of the Debian-based installation system. Only recommended when needed for expert Linux users.
- Virtual Machine Single Partition Quick Install - The same as Quick Install except that all system files are stored in a single partition. Use this option (or the equivalent no LVM option) when installing Malcolm onto a virtual machine.
- Virtual Machine Single Partition Quick Install (no LVM) - The same as Virtual Machine Single Partition Quick Install, only does not use Logical Volume Management (LVM) framework. Use this option (or the preceding one) when installing Malcolm onto a virtual machine.
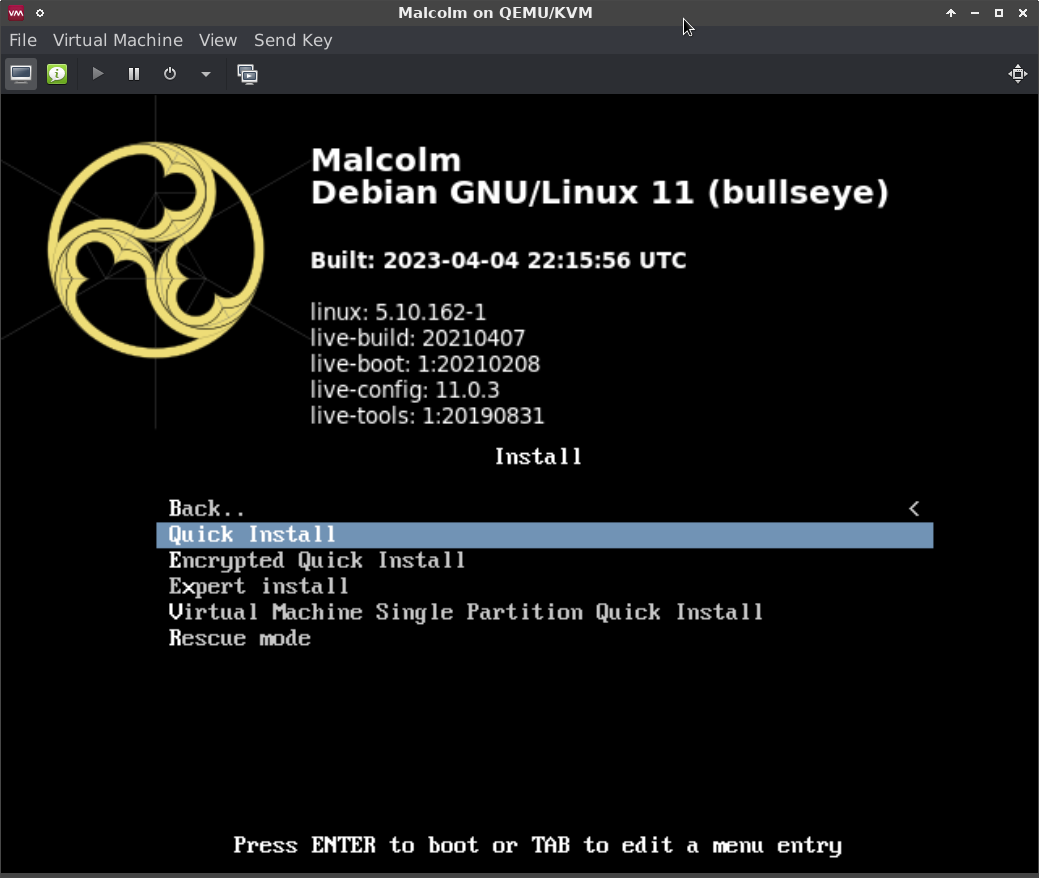
The Install Malcolm menu
After users select the type of Malcolm install to perform, the installer will ask for several pieces of information prior to installing the Malcolm base operating system:
- Hostname - the name of the Malcolm system used to identify itself on the network
- Domain name - (optional) the name of the local network domain
- Root password – (optional) a password for the privileged root account that is rarely needed; if unspecified, the non-privileged user account will be added to the
sudogroup - User name - the name for the non-privileged service account user account under which the Malcolm processes run
- User password – a password for the non-privileged user account
- Encryption password – (optional) if the encrypted installation option was selected at boot, the encryption password must be entered every time the system boots
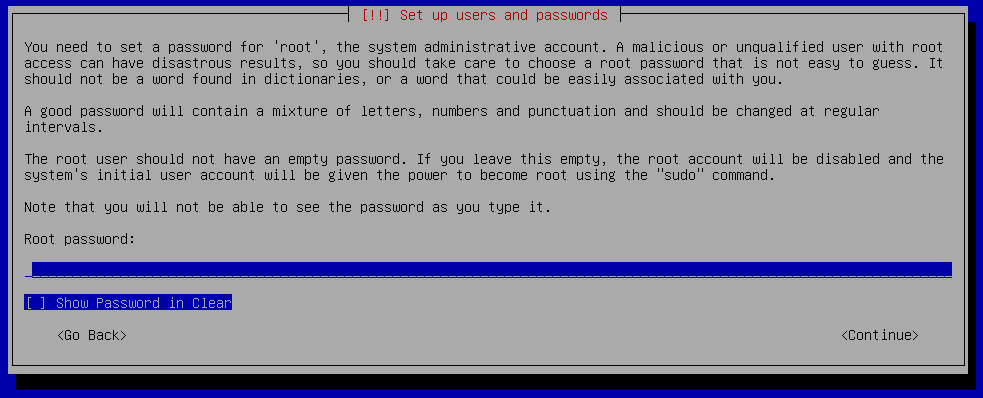
After the passwords have been entered, the installer will proceed to format the system drive and install Malcolm.

At the end of the installation process, users will be prompted with a few self-explanatory yes/no questions:
- Format non-OS drive(s) for artifact storage? (Note that if the Encrypted Quick Install installation option was chosen, any non-OS drives formatted for artifact storage will also be configured with full-disk encryption)
- Disable IPv6?
- Automatically log in to the GUI session?
- Should the GUI session be locked due to inactivity?
- Display the Standard Mandatory DoD Notice and Consent Banner? (only applies when installed on U.S. government information systems)
- Allow SSH password authentication? (Caution: password authentication is less secure than public/private key pairs)
Following these prompts, the installer will reboot and the Malcolm base operating system will boot.
The Malcolm installer does not require an Internet connection to complete successfully. If the installer prompts users to configure network connectivity, they may choose “do not configure the network at this time.”
Desktop Environment
The Malcolm base operating system is a hardened Linux installation based on the current stable release of Debian running the XFCE desktop environment. The system has been preloaded with all of the components that make up Malcolm.
NetworkManager can be used to configure networking for Malcolm. NetworkManager can be configured by clicking the 🖧 (networked computers) icon in the system tray in the upper-right, or right-clicking the icon and selecting Edit Connections… to modify the properties of a given connection.
Display resolution should be detected and adjusted automatically. To make changes to display properties, click the Applications menu and select Settings → Display.
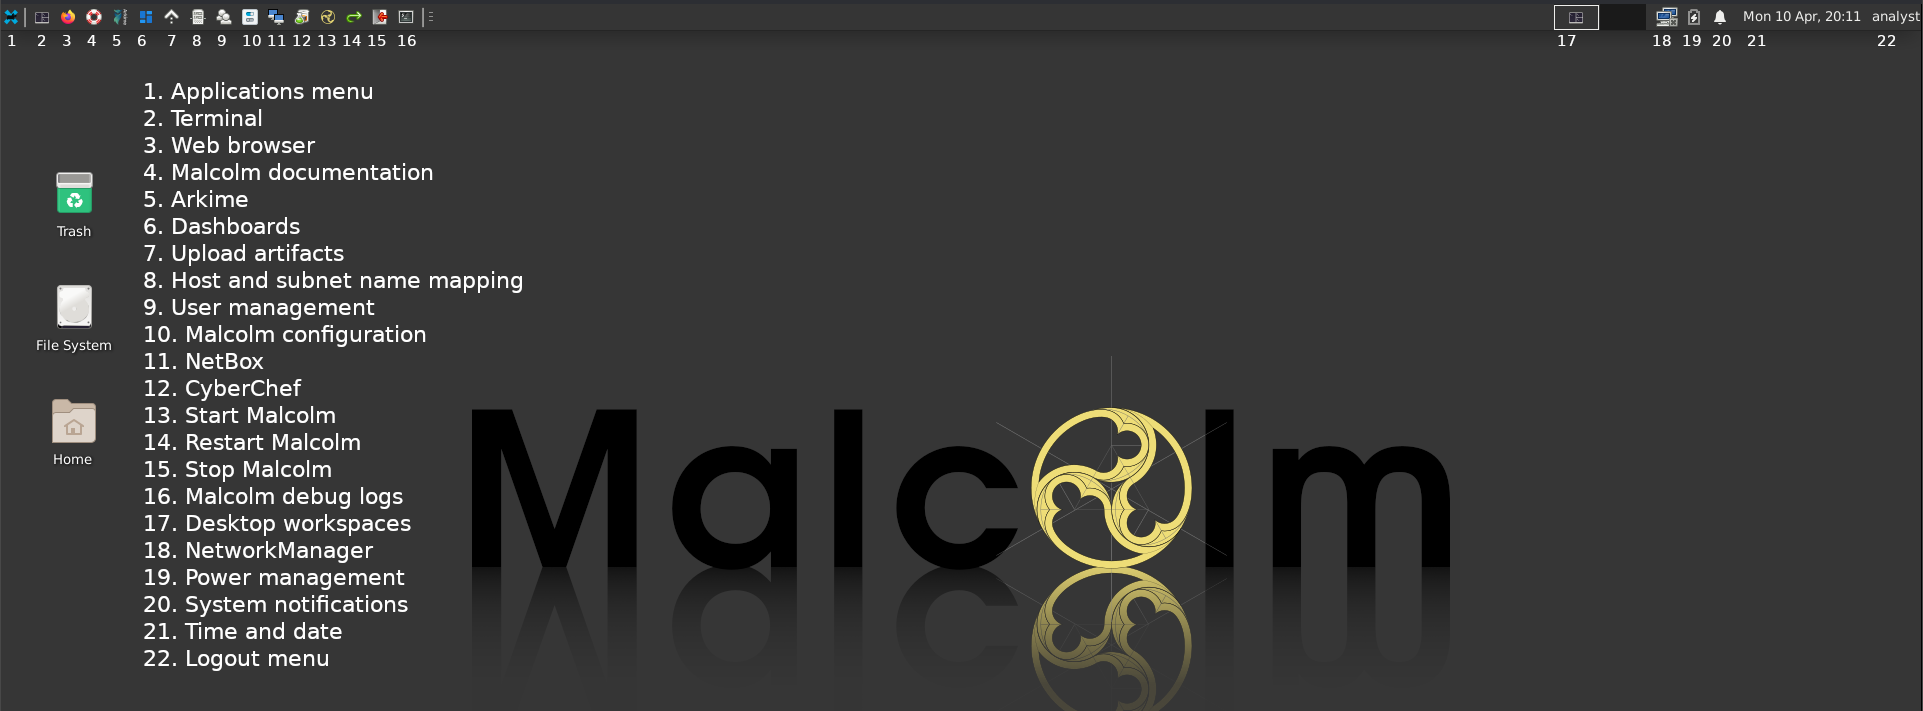
The panel bordering the top of the Malcolm desktop is home to a number of useful shortcuts:
Configure Network Interfaces
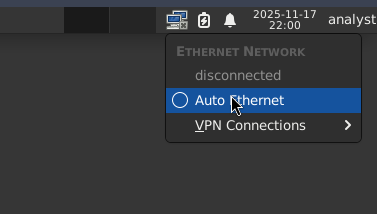
The Malcolm base operating system does not use Dynamic Host Configuration Protocol (DHCP) to assign IP addresses to any ethernet interfaces by default. To configure DHCP for network interfaces intended for access and management, click the icon for the NetworkManager applet in the system tray and select Auto Ethernet:
Alternatively, to configure a network interface with a static IP address (recommended):
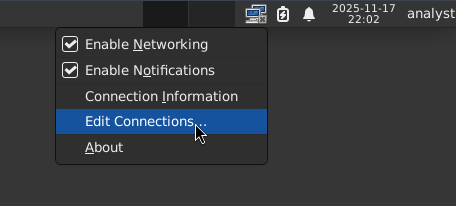
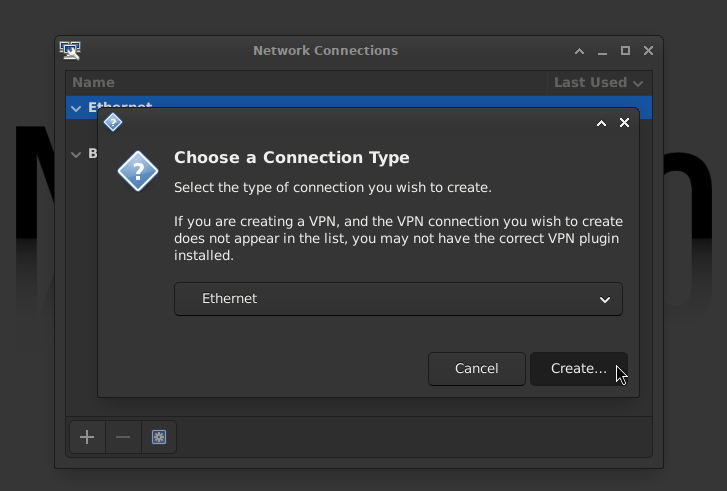
- Right-click the icon for the NetworkManager applet in the system tray and select Edit Connections
- Click the plus ➕ icon on the Network Connections dialog
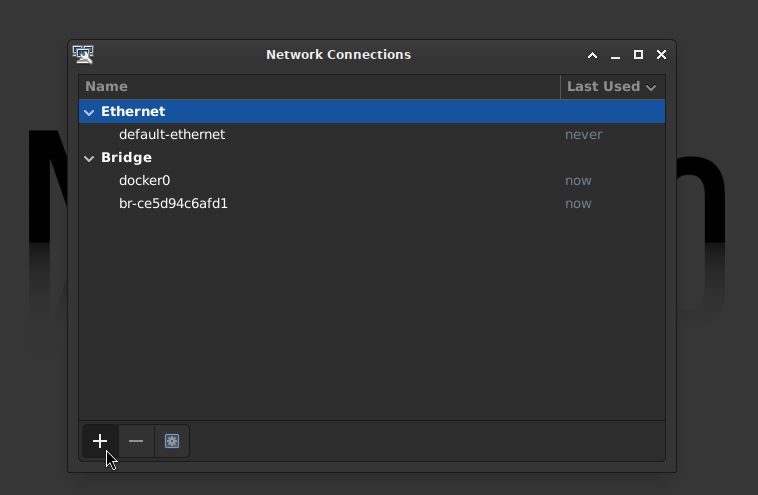
- Select Ethernet for the Connection Type
- On the Ethernet tab, select the Device (e.g.,
eth0,enp1s0, etc.) on
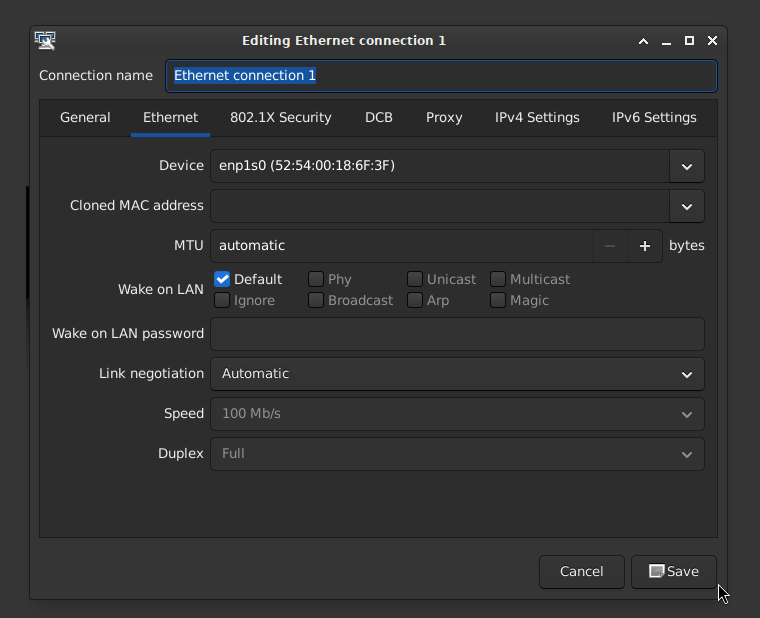
- On the IPv4 Settings tab, set the method Manual and add the address/netmask/gateway and specify DNS servers, if applicable
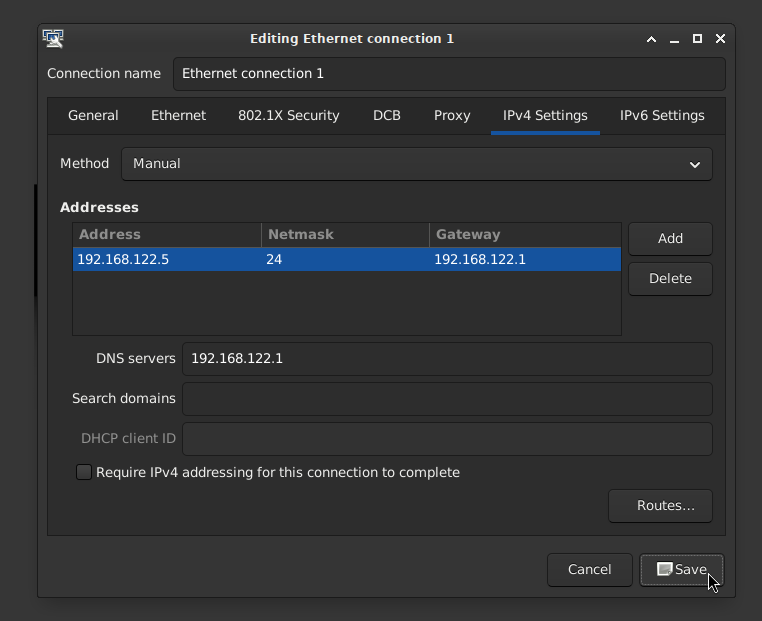
- Click Save
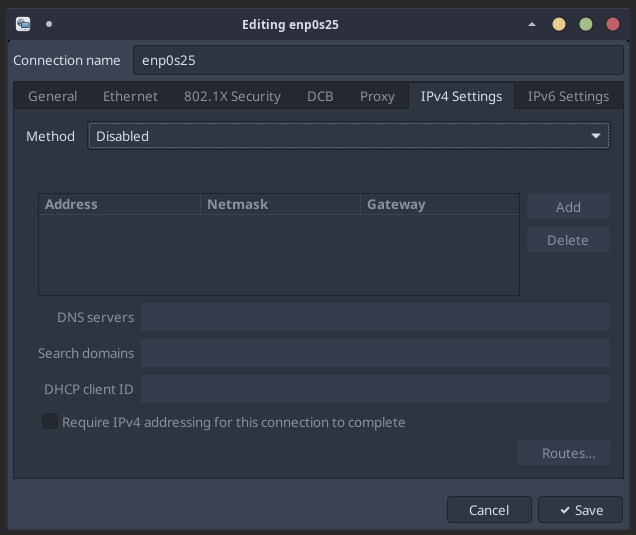
All network interfaces intended for capture only should have their method set to Disabled under the IPv4 Settings tab:
Configure Hostname, Time Sync, and SSH Access
If users wish to change Malcolm’s hostname or configure system time synchronization, they can open a terminal (the icon immediately to the right of the Applications menu icon at the top of the Malcolm desktop) and run system-quickstart then enter the user (if the user is part of the sudo group) or root password.
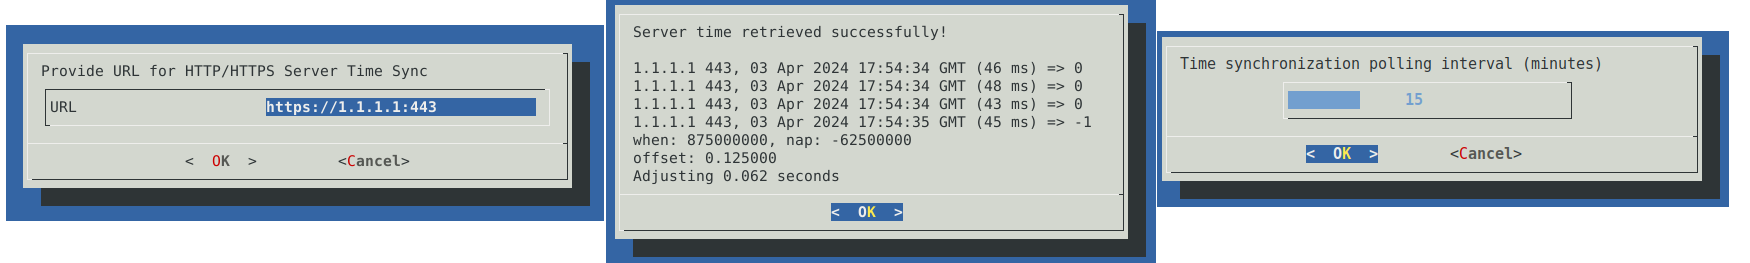
Here users can configure Malcolm to keep its time synchronized with either an NTP server (using the NTP protocol), another Malcolm aggregator or another HTTP/HTTPS server. On the next dialog, choose the time synchronization method to configure.
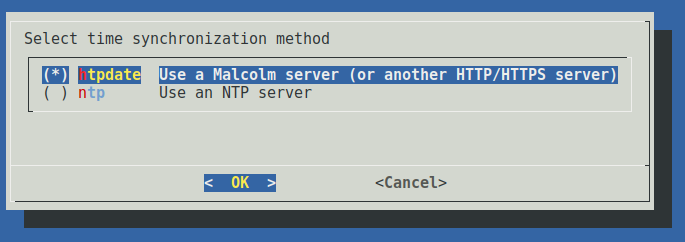
If htpdate is selected, users will be prompted to enter the URL of an HTTP/HTTPS server (for another Malcolm instance, either port 443 or port 9200 over https may be used) and the time synchronization check frequency in minutes. A test connection will be made to determine if the time can be retrieved from the server.
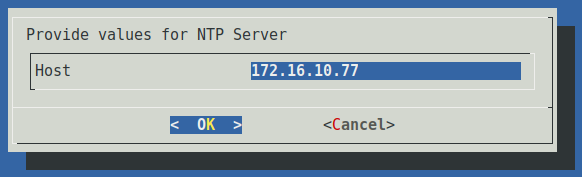
If ntpdate is selected, users will be prompted to enter the IP address or hostname of the NTP server.
Upon configuring time synchronization, a “Time synchronization configured successfully!” message will be displayed, after which users will be returned to the welcome screen. Select Cancel.
This same utility can be used to enable SSH password authentication. (Caution: password authentication is less secure than public/private key pairs.)
Configure Malcolm
The first time the Malcolm base operating system boots the Malcolm Configuration wizard will start automatically. This same configuration script can be run again later by running ./scripts/configure from the Malcolm installation directory, or clicking the Configure Malcolm 🔳 icon in the top panel.
The configuration script’s dialog- and terminal-based user interfaces identical configuration workflows with only slightly different presentations. This document will use the terminal-based (“TUI”) interface, which can be forced by running install.py with the --tui flag, as opposed to the dialog-based (“DUI”) interface, which can be forced with the --dui flag.
Users will first be presented with a Malcolm logo splash screen unless the --skip-splash flag is specified.
user@host:~/Malcolm$ ./scripts/configure

                                                     Welcome To

 ██████   ██████        █████        ████              ██████████████     █████     ████              ██████   ██████
░░██████ ██████       ███░░░███     ░░███             ░░███░░░░░░░░░██   ███  ██   ░░███             ░░██████ ██████
 ░███░█████░███      ███   ░░███     ░███              ░███        ░░   █████████   ░███              ░███░█████░███
 ░███░░███ ░███     █████████████    ░███              ░███             ████ ████   ░███              ░███░░███ ░███
 ░███ ░░░  ░███    ░███░░░░░░░███    ░███              ░███             ████ ████   ░███              ░███ ░░░  ░███
 ░███      ░███    ░███      ░███    ░███              ░███             █ ███████   ░███              ░███      ░███
 ░███      ░███    ░███      ░███    ░███              ░███         ██  ██████ ██   ░███              ░███      ░███
 █████     █████   █████     █████   ██████████████    ██████████████    ███████    ██████████████    █████     █████
░░░░░     ░░░░░   ░░░░░     ░░░░░   ░░░░░░░░░░░░░░    ░░░░░░░░░░░░░░      █████    ░░░░░░░░░░░░░░    ░░░░░     ░░░░░

                                       v26.07.1. Press any key to continue...
The items in the Malcolm Configuration Menu are arranged hierarchically, with the current setting displayed next to each option. For the most part, each option in the menu corresponds to an environment variable stored in the ./config directory, used by Malcolm to determine runtime behavior.
--- Malcolm Configuration Menu ---
Select an item number to configure, or an action:
├── 1. Container Runtime (current: docker)
│ ├── 2. Container Network Name (current: empty)
│ ├── 3. Malcolm Restart Policy (current: No)
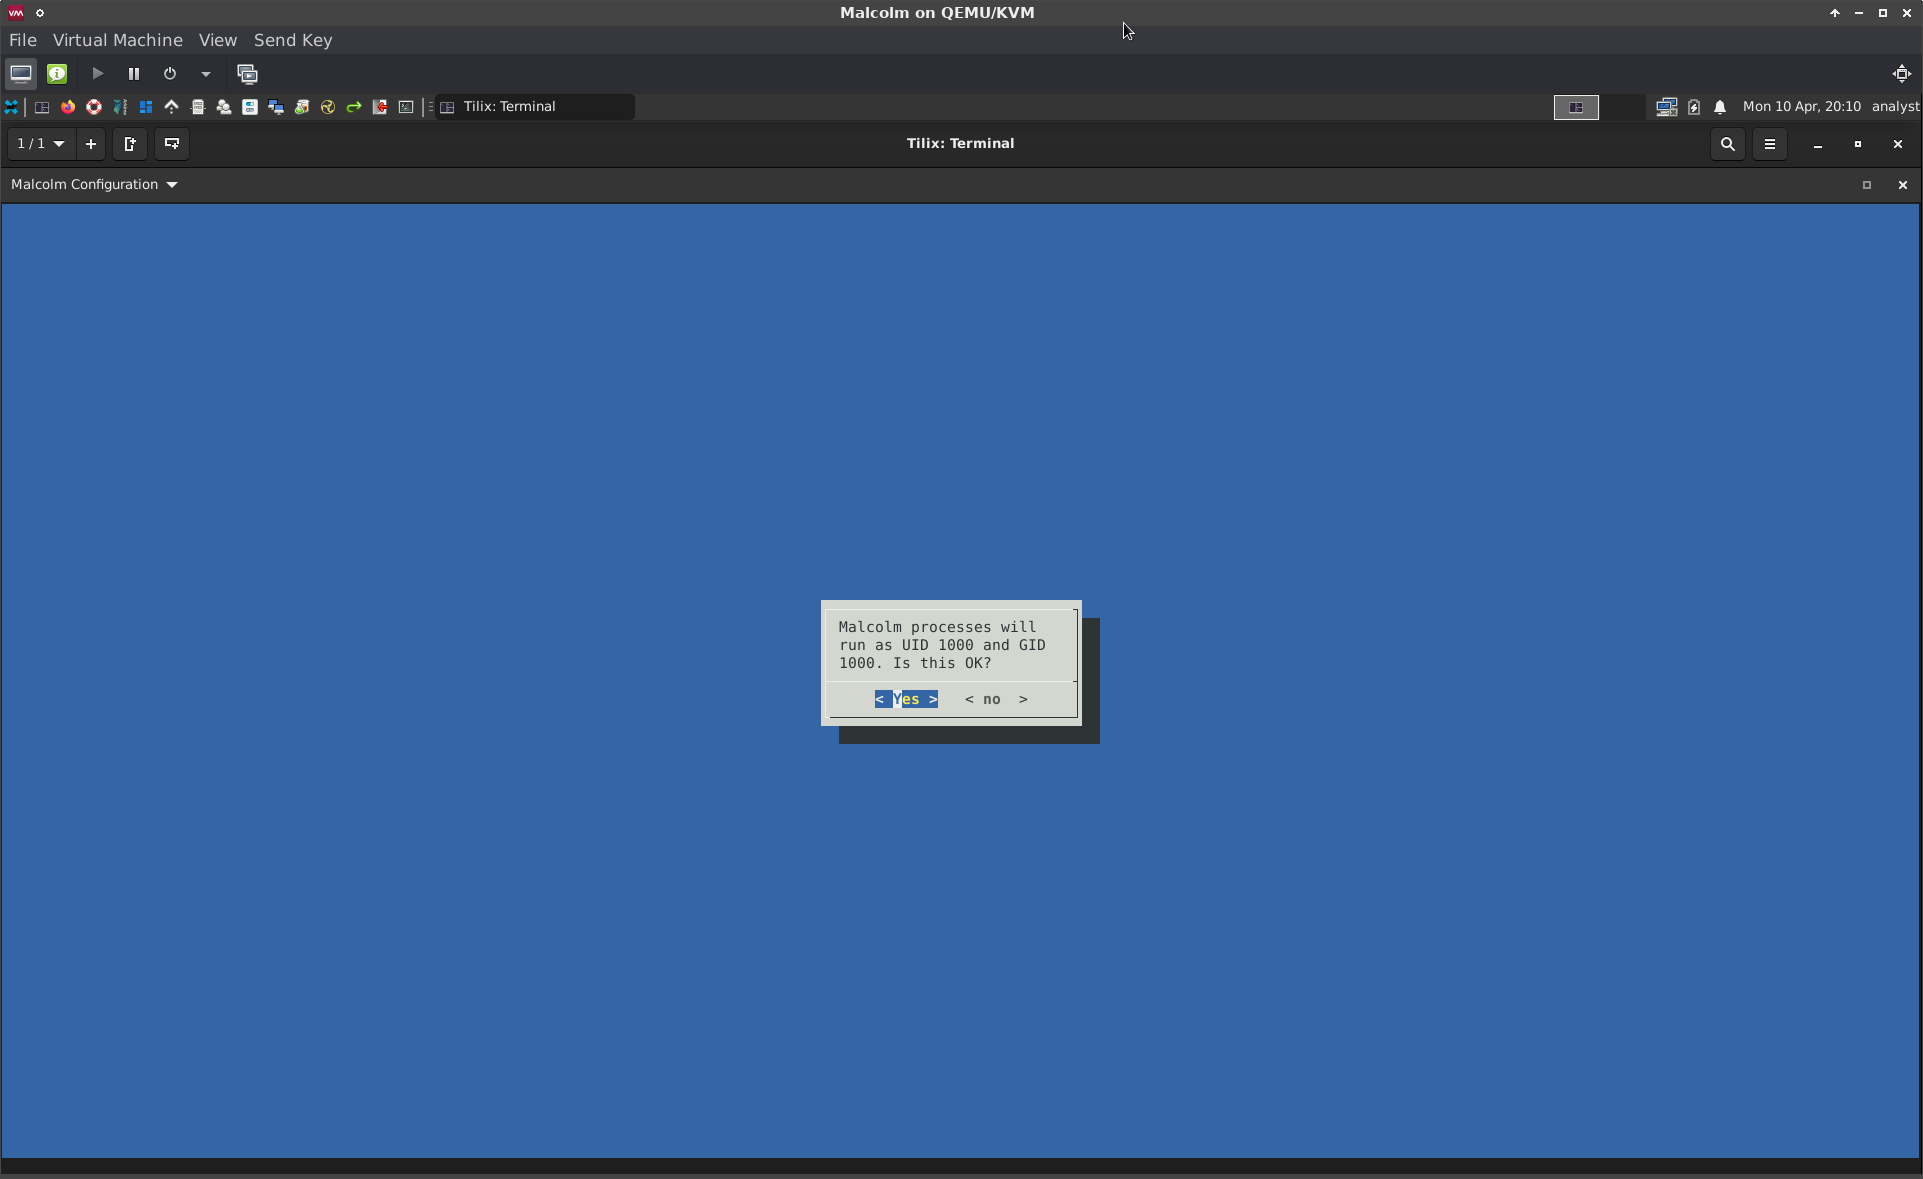
│ ├── 4. Process Group ID (current: 1000)
│ └── 5. Process User ID (current: 1000)
├── 6. Run Profile (current: malcolm)
│ ├── 7. Dark Mode for Dashboards (current: Yes)
│ ├── 8. Extra Tags (current: [])
│ ├── 9. Forward AIDE Results (current: No)
│ ├── 10. Forward Audit Log (current: No)
│ ├── 11. Forward CPU Utilization (current: No)
│ ├── 12. Forward Disk Operation Statistics (current: No)
│ ├── 13. Forward Disk Utilization (current: No)
│ ├── 14. Forward Kernel Messages (current: No)
│ ├── 15. Forward Logs to Remote Secondary Store (current: No)
│ ├── 16. Forward Memory Utilization (current: No)
│ ├── 17. Forward Network Activity (current: No)
│ ├── 18. Forward Systemd Journal Logs (current: No)
│ ├── 19. Forward Thermal Readings (current: No)
│ ├── 20. Logstash Memory (current: 3g)
│ ├── 21. Logstash Workers (current: 3)
│ ├── 22. OpenSearch Memory (current: 31g)
│ └── 23. Primary Document Store (current: opensearch-local)
├── 24. Require HTTPS Connections (current: Yes)
├── 25. IPv4 for nginx Resolver Directive (current: Yes)
├── 26. IPv6 for nginx Resolver Directive (current: No)
├── 27. Traefik Labels (current: No)
├── 28. Use Default Storage Location (current: Yes)
├── 29. Clean Up Artifacts (current: Yes)
│ ├── 30. Arkime PCAP Management (current: Yes)
│ │ └── 31. Delete PCAP Threshold (current: 5%)
│ ├── 32. Delete Old Indices (current: Yes)
│ │ ├── 33. Index Prune Threshold (current: 1T)
│ │ └── 34. Prune Indices by Name (current: No)
│ ├── 35. Prune Oldest Logs (current: No)
│ └── 36. Prune Oldest PCAP (current: No)
├── 37. Enable Arkime Index Management (current: No)
├── 38. Enable Arkime Analysis (current: Yes)
│ ├── 39. Allow Arkime WISE Configuration (current: No)
│ └── 40. Enable Arkime WISE (current: Yes)
├── 41. Enable Suricata Analysis (current: Yes)
│ └── 42. Enable Suricata Rule Updates (current: Yes)
├── 43. Enable Zeek Analysis (current: Yes)
│ ├── 44. Enable Zeek ICS/OT Analyzers (current: Yes)
│ │ └── 45. Enable Zeek ICS "Best Guess" (current: Yes)
│ ├── 46. File Extraction Mode (current: interesting)
│ │ ├── 47. Extracted File Percent Threshold (current: 0)
│ │ ├── 48. Extracted File Size Threshold (current: 100G)
│ │ ├── 49. File Preservation (current: quarantined)
│ │ ├── 50. File scanning workers (current: 1)
│ │ ├── 51. Preserved Files HTTP Server (current: Yes)
│ │ │ ├── 52. Downloaded Preserved File Password (current: ********)
│ │ │ └── 53. Zip Downloads (current: Yes)
│ │ ├── 54. Scan with Strelka (current: Yes)
│ │ └── 55. Update Scan Rules (current: Yes)
│ └── 56. Use Threat Feeds for Zeek Intelligence (current: Yes)
│ ├── 57. Cron Expression for Threat Feed Updates (current: 0 0 * * *)
│ ├── 58. Intel::item_expiration Timeout (current: -1min)
│ ├── 59. Pull Threat Intelligence Feeds on Startup (current: Yes)
│ └── 60. Threat Indicator "Since" Period (current: 24 hours ago)
│ ├── 61. Use Intel on Live Traffic (current: Yes)
│ └── 62. Use Intel on Uploaded PCAP (current: Yes)
├── 63. Enrich with Reverse DNS Lookups (current: Yes)
├── 64. Enrich with Manufacturer (OUI) Lookups (current: Yes)
├── 65. Enrich with Frequency Scoring (current: Yes)
├── 66. NetBox Mode (current: Local)
│ ├── 67. Auto-Create Subnet Prefixes (current: Yes)
│ ├── 68. Auto-Populate NetBox Inventory (current: Yes)
│ ├── 69. NetBox Enrichment (current: Yes)
│ ├── 70. NetBox IP Autopopulation Filter (current: empty)
│ └── 71. NetBox Site Name (current: Malcolm)
├── 72. Expose Malcolm Service Ports (current: No)
├── 73. Network Traffic Node Name (current: host)
└── 74. Capture Live Network Traffic (current: Yes)
├── 75. Analyze Live Traffic with Suricata (current: Yes)
├── 76. Analyze Live Traffic with Zeek (current: Yes)
├── 77. Capture Filter (current: empty)
├── 78. Capture Interface(s) (current: eth0)
├── 79. Capture Live Traffic with netsniff-ng (current: Yes)
├── 80. Capture Live Traffic with tcpdump (current: No)
├── 81. Gather Traffic Capture Statistics (current: Yes)
└── 82. Optimize Interface Settings for Capture (current: Yes)
--- Actions ---
s. Save and Continue
w. Where Is...? (search for settings)
x. Exit Installer
---------------------------------
Enter item number or action:
For some settings, additional sub-items will become available when that setting is enabled. For example, enabling Zeek File Extraction exposes the settings related to that feature:
├── 43. Enable Zeek Analysis (current: Yes)
│   ├── 44. Enable Zeek ICS/OT Analyzers (current: No)
│   ├── 45. File Extraction Mode (current: none)
│   └── 46. Use Threat Feeds for Zeek Intelligence (current: Yes)
…
Enter item number or action: 45
File Extraction Mode (current: none)
1: none
2: known
3: mapped
4: all
5: interesting
6: notcommtxt
Enter choice number (none): 5
…
├── 43. Enable Zeek Analysis (current: Yes)
│   ├── 44. Enable Zeek ICS/OT Analyzers (current: No)
│   ├── 45. File Extraction Mode (current: interesting)
│   │   ├── 46. Extracted File Percent Threshold (current: 0)
│   │   ├── 47. Extracted File Size Threshold (current: 100G)
│   │   ├── 48. File Preservation (current: quarantined)
│   │   ├── 49. File scanning workers (current: 1)
│   │   ├── 50. Preserved Files HTTP Server (current: Yes)
│   │   │   ├── 51. Downloaded Preserved File Password (current: ********)
│   │   │   └── 52. Zip Downloads (current: Yes)
│   │   ├── 53. Scan with Strelka (current: Yes)
│   │   └── 54. Update Scan Rules (current: Yes)
│   └── 55. Use Threat Feeds for Zeek Intelligence (current: Yes)
…
Enter item number or action: 48
File Preservation (current: quarantined)
1: quarantined
2: all
3: none
Enter choice number (quarantined): 1
Once the desired Malcolm configuration options have been selected, select s to save the settings and proceed to the final configuration summary for confirmation. Then, select y to write the changed configuration to the corresponding environment variable files.
…
--- Actions ---
  s. Save and Continue
  w. Where Is...? (search for settings)
  x. Exit Installer
---------------------------------

Enter item number or action: s
============================================================
FINAL CONFIGURATION SUMMARY
============================================================
Configuration Only                                : Yes
Configuration Directory                           : /home/user/Malcolm/config
Container Runtime                                 : docker
Run Profile                                       : malcolm
Process UID/GID                                   : 1000/1000
Container Restart Policy                          : unless-stopped
Container Network                                 : default
Default Storage Locations                         : Yes
HTTPS/SSL                                         : Yes
Node Name                                         : host
============================================================

Proceed with Malcolm installation using the above configuration? (y / N): y
Malcolm Configuration Menu Items
- Container Runtime
- When deployed locally (i.e., not via Kubernetes), Malcolm can run under Docker or Podman. However, for brevity’s sake, the term “Docker” is used throughout this documentation. It should be noted that if rootless Podman is used, Malcolm itself cannot perform traffic capture on local network interfaces, although it can accept network traffic metadata forwarded from a a network sensor appliance.
- Container Network Name
- This configures Malcolm to use custom container networks. If unsure, leave this blank.
- Malcolm Restart Policy
- This setting specifies Docker’s restart policy for Malcolm (i.e., the behavior used to restart Malcolm should the system be shut down or rebooted, or should one of Malcolm’s components crash). Possible options are:
no- do not automatically restart the containeron-failure- restart the container if it exits due to an error, which manifests as a non-zero exit codealways- always restart the container if it stopsunless-stopped- similar toalways, except that when the container is stopped (manually or otherwise), it is not restarted even after Docker daemon restarts; this is usually a good choice
- This setting specifies Docker’s restart policy for Malcolm (i.e., the behavior used to restart Malcolm should the system be shut down or rebooted, or should one of Malcolm’s components crash). Possible options are:
- Process Group ID and Process User ID
- Docker runs all of its containers as the privileged
rootuser by default. For better security, Malcolm immediately drops to non-privileged user accounts for executing internal processes wherever possible. ThePUID(process user ID) andPGID(process group ID) environment variables allow Malcolm to map internal non-privileged user accounts to a corresponding user account on the host.
- Docker runs all of its containers as the privileged
- Run Profile
- Malcolm can be run in either of two profiles: the
malcolmprofile runs all containers including those for log enrichment and indexing, while thehedgehogprofile (named as a nod to Hedgehog Linux, Malcolm’s dedicated network sensor OS) runs only the containers required for live traffic analysis. When using thehedgehogprofile, captured network artifacts must be forwarded to another Malcolm instance: its OpenSearch instance connection parameters (e.g.,https://192.168.122.5:9200) and Logstash connection parameters (e.g.,192.168.122.5:5044) must be specified later on in the configuration. See idaholab/Malcolm#254 for the origin of this feature. - Dark Mode for Dashboards
- Select Y for dark-themed dashboards or N for light-themed ones.
- Extra Tags
- Provide a comma-separated list of values to be added to the
tagsfield for logs processed by Malcolm. These tags may make it easier to identify or search for data during analysis.
- Provide a comma-separated list of values to be added to the
- Forward Logs to Remote Secondary Store
- Whether the primary OpenSearch instance is a locally maintained single-node instance or remote cluster, Malcolm can also be configured to forward logs to a secondary remote OpenSearch instance. See OpenSearch and Elasticsearch instances for more information about forwarding logs to another OpenSearch instance. If this option is enabled, sub-items will become available to configure the secondary document store type (
opensearch-remotevselasticsearch-remote) and URL.
- Whether the primary OpenSearch instance is a locally maintained single-node instance or remote cluster, Malcolm can also be configured to forward logs to a secondary remote OpenSearch instance. See OpenSearch and Elasticsearch instances for more information about forwarding logs to another OpenSearch instance. If this option is enabled, sub-items will become available to configure the secondary document store type (
- Forward …
- Malcolm uses Fluent Bit to gather miscellaneous system resource metrics (CPU, network I/O, disk I/O, memory utilization, temperature, etc.) and the Beats protocol to forward these metrics to its Logstash service for further enrichment prior to indexing into the OpenSearch database. Metrics categories can be enabled/disabled with the remaining Forward … options under the Run Profile section.
- Primary Document Store
- Malcolm’s default standalone configuration is to use a local OpenSearch instance in a container to index and search network traffic metadata. See OpenSearch and Elasticsearch instances for more information about using a remote OpenSearch or Elasticsearch cluster instead. The Primary Document Store option allows the user to select
opensearch-local(for Malcolm to maintain its own OpenSearch instance),opensearch-remote, orelasticsearch-remote. In the case of the-remoteoptions, the user can also specify the corresponding URL for the remote instance.
- Malcolm’s default standalone configuration is to use a local OpenSearch instance in a container to index and search network traffic metadata. See OpenSearch and Elasticsearch instances for more information about using a remote OpenSearch or Elasticsearch cluster instead. The Primary Document Store option allows the user to select
- OpenSearch Memory and Logstash Memory
- Two of Malcolm’s main components, OpenSearch and Logstash, require a substantial amount of memory. The configuration script will suggest defaults for these values based on the amount of physical memory the system has. The minimum recommended amount of system memory for Malcolm is 24 GB. Users should not use a value under 10 GB for OpenSearch and 2500 MB for Logstash.
- Logstash Workers
- This setting is used to tune the performance and resource utilization of the
logstashcontainer: it represents the number of worker threads for each parsing/enrichment pipeline used by Logstash for log processing. The default is calculated based on the number of logical CPUs the system has. See Tuning and Profiling Logstash Performance,logstash.ymland Multiple Pipelines.
- This setting is used to tune the performance and resource utilization of the
- Malcolm can be run in either of two profiles: the
- Require HTTPS Connections
- Malcolm uses TLS encryption for its web browser-accessible user interfaces. Setting Y for this option is almost always preferred. The only situation where N would be appropriate would be when running Malcolm behind a third-party reverse proxy (e.g., Traefik or Caddy) to handle the issuance of the certificates automatically and to broker the connections between clients and Malcolm. Reverse proxies such as these often implement the ACME protocol for domain name authentication and can be used to request certificates from certificate authorities such as Let’s Encrypt. In this configuration, the reverse proxy will be encrypting the connections instead of Malcolm. Users should ensure they understand these implications and ensure that external connections cannot reach ports over which Malcolm will be communicating without encryption, including verifying the local firewall configuration, when setting this to N.
- IPv4 for nginx Resolver Directive and IPv6 for nginx Resolver Directive
- These settings configure the resolver directives for Malcolm’s nginx reverse proxy. Note that this selection does not affect Malcolm’s ability to capture or inspect IPv4/IPv6 traffic: it is only used if and when nginx itself needs to resolve hostnames in the network in which Malcolm resides. See related settings for nginx in the
nginx.envconfiguration file.
- These settings configure the resolver directives for Malcolm’s nginx reverse proxy. Note that this selection does not affect Malcolm’s ability to capture or inspect IPv4/IPv6 traffic: it is only used if and when nginx itself needs to resolve hostnames in the network in which Malcolm resides. See related settings for nginx in the
- Traefik Labels
- If Malcolm is configured behind Traefik, a Docker-aware remote proxy, Malcolm needs to be able to identify its endpoints to the proxy service. Enabling this setting exposes sub-items for specifying the values for the labels used for Traefik.
- Use Default Storage Location
- Malcolm generates a number of large file sets during normal operation: PCAP files, Zeek or Suricata logs, OpenSearch indices, etc. By default all of these are stored in subdirectories in the Malcolm installation directory. This option and its sub-items allows users to specify alternative storage location(s) (for example, a separate dedicated drive or RAID volume) for these artifacts.
- Clean Up Artifacts
- Choose Y to expose the following sub-items used to manage the data storage used by Malcolm.
- Delete Old Indices and Index Prune Threshold
- Most of the configuration around OpenSearch Index State Management and Snapshot Management can be done in OpenSearch Dashboards. In addition to (or instead of) the OpenSearch index state management operations, Malcolm can also be configured to delete the oldest network session metadata indices when the database exceeds a certain size to prevent filling up all available storage with OpenSearch indices.
- Delete Old PCAP and Delete PCAP Threshold
- Selecting Y allows Arkime to prune (delete) old PCAP files based on available disk space (see https://arkime.com/faq#pcap-deletion). When Arkime PCAP-deletion is enabled, rkime will delete PCAP files when free space is lower than this threshold value, specified as integer gigabytes (e.g.,
500) or a percentage (e.g.,10%)
- Selecting Y allows Arkime to prune (delete) old PCAP files based on available disk space (see https://arkime.com/faq#pcap-deletion). When Arkime PCAP-deletion is enabled, rkime will delete PCAP files when free space is lower than this threshold value, specified as integer gigabytes (e.g.,
- Enable Arkime Index Management
- Choose Y to expose to the following sub-items for using ILM/ISM with Arkime.
- History Retention (Weeks)
- This defines the retention period (in weeks) for
arkime-historyindices.
- This defines the retention period (in weeks) for
- Hot Node Time Period
- This allows users to specify how long an Arkime index should remain in the hot state before moving into a warm state.
- Optimize Segments
- This defines the number of segments to use for optimization.
- Replica Count (Warm)
- This defines how many additional copies of older session indices Arkime should store.
- SPI Data Retention
- This defines the maximum age at which Arkime session indices are deleted.
- Use Hot/Warm Indexing
- This specifies whether Arkime should store non-session indices (
arkime-history) indices in a warm index. This requires additional configuration as demonstrated in the Arkime documentation.
- This specifies whether Arkime should store non-session indices (
- Enable Arkime Analysis
- This option is used to enable Arkime to analyze PCAP files uploaded to Malcolm via its upload web interface.
- Enable Arkime WISE, Allow Arkime WISE Configuration, and Arkime WISE URL
- These settings control the Arkime WISE configuration.
- Enable Suricata Analysis
- This option is used to enable Suricata (an IDS and threat detection engine) to analyze PCAP files uploaded to Malcolm via its upload web interface.
- Enable Suricata Rule Updates
- If the Malcolm instance has Internet connectivity, select Y to enable automatic updates of the Suricata rules used by Malcolm. This setting also applies to the rules used for live analysis when Analyze Live Traffic with Suricata is enabled.
- Enable Zeek Analysis
- This option is used to enable Zeek (a network analysis framework and IDS) to analyze PCAP files uploaded to Malcolm via its upload web interface.
- These options are used to configure automatic file extraction and scanning:
- File Extraction Mode
- This determines which files Zeek should extract for scanning:
none: no file extractioninteresting: extraction of files with mime types of common attack vectorsmapped: extraction of files with recognized mime typesknown: extraction of files for which any mime type can be determinedall: extract all filesnotcommtxt: extract all files except common plain text files
- This determines which files Zeek should extract for scanning:
- Scan with Strelka
- Choosing Y enables scanning of Zeek-extracted files with Strelka.
- File scanning workers
- This specifies the number of Strelka backend instances performing file scanning concurrently.
- Extracted File Percent Threshold and Extracted File Size Threshold
- Files extracted by Zeek can be periodically pruned to ensure the disk storage they consume does not exceed a user-specified threshold. See the documentation on managing Malcolm’s disk usage for more information.
- File Preservation
- This determines the behavior for preservation of Zeek-extracted files:
quarantined: preserve only flagged files in./zeek-logs/extract_filesall: preserve all extracted files./zeek-logs/extract_filesnone: preserve no extracted files
- This determines the behavior for preservation of Zeek-extracted files:
- Preserved Files HTTP Server
- Choosing Y enables access to the Zeek-extracted files path through the means of a simple HTTPS directory server at https://﹤Malcolm host or IP address﹥/extracted-files/. Beware that Zeek-extracted files may contain malware.
- Downloaded Preserved File Password
- A non-blank value will be used as either the ZIP archive file password (if Zip Downloads is enabled) or as the encryption key for the file to be AES-256-CBC-encrypted in an
openssl enc-compatible format (e.g.,openssl enc -aes-256-cbc -d -in example.exe.encrypted -out example.exe).
- A non-blank value will be used as either the ZIP archive file password (if Zip Downloads is enabled) or as the encryption key for the file to be AES-256-CBC-encrypted in an
- Zip Downloads
- Selecting Y will cause that Zeek-extracted file downloads will be archived using the ZIP file format.
- Update Scan Rules
- If the Malcolm instance has Internet connectivity, choose Y to enable periodic downloads of signatures used by ClamAV and YARA.
- File Extraction Mode
- Enable Zeek ICS/OT Analyzers
- If using Malcolm in a control systems (OT/ICS) network, select Y to enable Malcolm’s ICS protocol analyzers for Zeek.
- Enable Zeek ICS “Best Guess”
- If using Malcolm in a control systems (OT/ICS) network, select Y to enable “Best Guess” Fingerprinting for ICS Protocols.
- Use Threat Feeds for Zeek Intelligence
- Select Y to configure pulling from threat intelligence feeds to populate the Zeek intelligence framework.
- Cron Expression for Threat Feed Updates
- Specifies a cron expression (using
cronexpr-compatible syntax) indicating the refresh interval for generating the Zeek Intelligence Framework files.
- Specifies a cron expression (using
Intel::item_expirationTimeout- Specifies the value for Zeek’s
Intel::item_expirationtimeout as used by the Zeek Intelligence Framework (default-1min, which disables item expiration).
- Specifies the value for Zeek’s
- Pull Threat Intelligence Feeds on Startup
- Select Y for Malcolm to pull from threat intelligence feeds when the
zeek-offlinecontainer starts up.
- Select Y for Malcolm to pull from threat intelligence feeds when the
- Threat Indicator “Since” Period
- When querying a TAXII, MISP, Google, or Mandiant threat intelligence feed, only process threat indicators created or modified since the time represented by this value; it may be either a fixed date/time (
01/01/2025) or relative interval (24 hours ago). Note that this value can be overridden per-feed by adding asince:value to each feed’s respective configuration YAML file.
- When querying a TAXII, MISP, Google, or Mandiant threat intelligence feed, only process threat indicators created or modified since the time represented by this value; it may be either a fixed date/time (
- Use Intel on Live Traffic
- Select Y for Zeek (in the
zeek-livecontainer) to use threat intel data when analyzing live traffic.
- Select Y for Zeek (in the
- Use Intel on Uploaded PCAP
- Select Y for Zeek (in the
zeekcontainer) to use threat intel data when analyzing historical traffic (i.e., uploaded PCAP).
- Select Y for Zeek (in the
- Enrich with Reverse DNS Lookups
- If enabled, this option will perform reverse DNS lookups on IP addresses found in traffic and use the results to enrich network logs. Select Y if the Malcolm instance has access to a DNS server to perform these lookups.
- Enrich with Manufacturer (OUI) Lookups
- Malcolm will map MAC addresses to hardware manufacturer when possible. Users probably want to select Y for this setting.
- Enrich with Frequency Scoring
- If enabled, domain names observed in network traffic (from DNS queries and SSL server names) will be assigned entropy scores as calculated by
freq. Users probably want to select Y for this setting.
- If enabled, domain names observed in network traffic (from DNS queries and SSL server names) will be assigned entropy scores as calculated by
- NetBox Mode
- Specifies whether Malcolm will use NetBox, a tool for modeling networks and documenting network assets; options are
local(use an embedded instance NetBox maintained by Malcolm),remote(use a remote instance of NetBox), ordisabled(do not use NetBox). - Auto-Create Subnet Prefixes
- Select Y to automatically create NetBox IP prefixes for private address space based on observed traffic.
- Auto-Populate NetBox Inventory
- Select Y to populate the NetBox inventory based on observed network traffic. Autopopulation is not recommended: manual inventory population is the preferred method to create an accurate representation of the intended network design.
- NetBox Enrichment
- Select Y to cross-reference network traffic logs against the NetBox asset inventory.
- NetBox-Enriched Log Types
- Defines which types of logs will be enriched via NetBox: a comma-separated list which may contain
provider.datasetpairs (e.g.,zeek.dns), the stringdefaultfor the built-in list of log types,ics(orot) to enrich OT/ICS traffic, orallto enrich all logs. Values may be combined (e.g.,default,ics).
- Defines which types of logs will be enriched via NetBox: a comma-separated list which may contain
- NetBox Site Name
- NetBox has the concept of sites; this default site name will be used for NetBox enrichment lookups performed by Logstash and will be associated with traffic Malcolm itself captures on local interfaces.
- NetBox IP Autopopulation Filter
- Defines the filter for subnets considered for autopopulation, which can be used to excluding IP ranges (such as dynamic address ranges used by DHCP) which should not trigger autopopulation in NetBox.
- Specifies whether Malcolm will use NetBox, a tool for modeling networks and documenting network assets; options are
- Expose Malcolm Service Ports
- Select yes or no in order for Malcolm’s firewall to allow or block connections for OpenSearch, Logstash, and Filebeat TCP, bypassing the following sub-items in this list. Select customize to proceed to enable or disable exposing of the following services individually:
- Expose Filebeat TCP
- Select Y in order for Malcolm’s firewall to allow connections from a remote log forwarder (such as Hedgehog Linux for resource utilization metrics or other forwarders for other third-Party logs) to TCP port 5045.
- Use Filebeat TCP Listener Defaults
- Select Y to use the defaults (recommended) or N to specify custom values for the Filebeat TCP listener.
- Filebeat TCP Log Format
- Possible choices include
jsonandraw; users probably want to choosejson. - Filebeat TCP Drop Field
- Users most likely want this to be the default,
message, to match the field name specified above.
- Users most likely want this to be the default,
- Filebeat TCP Source Field
- The default choice (and the one Hedgehog Linux will be sending) is
message.
- The default choice (and the one Hedgehog Linux will be sending) is
- Filebeat TCP Target Field
- The default choice (and the one that corresponds to Malcolm’s dashboards built for the resource utilization metrics sent by Hedgehog Linux) is
miscbeat.
- The default choice (and the one that corresponds to Malcolm’s dashboards built for the resource utilization metrics sent by Hedgehog Linux) is
- Filebeat TCP Tag
- The default is
_malcolm_beats, which is used by Malcolm to recognize and parse metrics sent from Hedgehog Linux.
- The default is
- Possible choices include
- Expose Logstash
- Select Y in order for Malcolm’s firewall to allow connections from a remote log forwarder (such as Hedgehog Linux) to TCP port 5044 so that Zeek and Suricata logs can be ingested by Malcolm’s Logstash instance.
- Expose OpenSearch
- Select Y in order for Malcolm’s firewall to allow connections from a remote log forwarder (such as Hedgehog Linux) to TCP port 9200 so that Arkime sessions can be written to Malcolm’s OpenSearch database.
- Expose SFTP
- Users should select N unless they plan to use SFTP/SCP to upload PCAP files to Malcolm; select Y will expose TCP port 8022 in Malcolm’s firewall for SFTP/SCP connections
- Syslog TCP Port and Syslog UDP Port
- Specify the port numbers on which over which to accept syslog messages according to the RFC3164 and RFC5424 standards over TCP or UDP, respectively, or
0to disable that listener. Other options for configuring how Malcolm accepts and processes syslog messages can be configured via environment variables infilebeat.env. - If Malcolm is running in an instance installed via the Malcolm installer ISO, please see also ISO-installed Desktop Environment Firewall.
- Specify the port numbers on which over which to accept syslog messages according to the RFC3164 and RFC5424 standards over TCP or UDP, respectively, or
- Network Traffic Node Name
- Specifies the node name (usually the Malcolm instance’s host name) to associate with network traffic metadata.
- Capture Live Network Traffic
- Malcolm itself can perform live analysis of traffic it sees on another network interface (ideally not the same one used for its management). Select no to this question in installations where Hedgehog Linux will be handling all network traffic capture. If users want Malcolm to observe and capture traffic instead of, or in addition to, a sensor running Hedgehog Linux, they should select yes and proceed to configure the following sub-items individually.
- Analyze Live Traffic with Suricata
- Selecting Y will allow Malcolm itself to perform live traffic analysis using Suricata.
- Analyze Live Traffic with Zeek
- Selecting Y will allow Malcolm itself to perform live traffic analysis using Zeek.
- Capture Filter
- If Malcolm is doing its own live traffic analysis as described above, users may optionally provide a capture filter. This filter will be used to limit what traffic the PCAP service (netsniff-ng or tcpdump) and the traffic analysis services (Zeek and Suricata) will see. Capture filters are specified using Berkeley Packet Filter (BPF) syntax. For example, to indicate that Malcolm should ignore the ports it uses to communicate with Hedgehog Linux, users could specify
not port 5044 and not port 5045 and not port 8005 and not port 8006 and not port 9200.
- If Malcolm is doing its own live traffic analysis as described above, users may optionally provide a capture filter. This filter will be used to limit what traffic the PCAP service (netsniff-ng or tcpdump) and the traffic analysis services (Zeek and Suricata) will see. Capture filters are specified using Berkeley Packet Filter (BPF) syntax. For example, to indicate that Malcolm should ignore the ports it uses to communicate with Hedgehog Linux, users could specify
- Capture Interface(s)
- Specify the network interface(s) for live traffic analysis if it is enabled for netsniff-ng, tcpdump, Suricata or Zeek as described above. For multiple interfaces, separate the interface names with a comma (e.g.,
enp0s25orenp10s0,enp11s0).
- Specify the network interface(s) for live traffic analysis if it is enabled for netsniff-ng, tcpdump, Suricata or Zeek as described above. For multiple interfaces, separate the interface names with a comma (e.g.,
- Capture Live Traffic with netsniff-ng
- Select Y to use netsniff-ng to generate PCAP files to be periodically rotated into Arkime for analysis. netsniff-ng is Malcolm’s preferred tool for capturing network traffic.
- Capture Live Traffic with tcpdump
- Select Y to use tcpdump (instead of netsniff-ng) to generate PCAP files to be periodically rotated into Arkime for analysis.
- Capture Live Traffic with Arkime
- When running the “Hedgehog” run profile, when using a remote OpenSearch or Elasticsearch instance, or in a Kubernetes-based deployment, users may choose to have Arkime’s
capturetool monitor live traffic on the network interface without using netsniff-ng or tcpdump to generate intermediate PCAP files. See Live Analysis for more information. If the sensor is capturing locally but not forwarding to a Malcolm aggregator, use netsniff-ng or tcpdump instead.
- When running the “Hedgehog” run profile, when using a remote OpenSearch or Elasticsearch instance, or in a Kubernetes-based deployment, users may choose to have Arkime’s
- Gather Traffic Capture Statistics
- If Malcolm is doing its own live traffic analysis and users enable this setting, Malcolm will gather capture statistics for Zeek and Suricata to populate the Packet Capture Statistics dashboard.
- Optimize Interface Settings for Capture
- If Malcolm is doing its own live traffic analysis and this option is enabled, Malcolm will use
ethtoolto disable NIC hardware offloading features and adjust ring buffer sizes for capture interface(s) to improve performance; this should be enabled if the interface(s) are being used for capture only; otherwise, select N. If unsure, users should probably answer N.
- If Malcolm is doing its own live traffic analysis and this option is enabled, Malcolm will use
Setting up Authentication
Once the configuration questions have been completed as described above, users can click the “play” icon (▷) in the panel at the top of the desktop to start Malcolm. As authentication has not yet been configured, users will be prompted to do so. This authentication setup can be run again later by running ./scripts/auth_setup from the Malcolm installation directory.
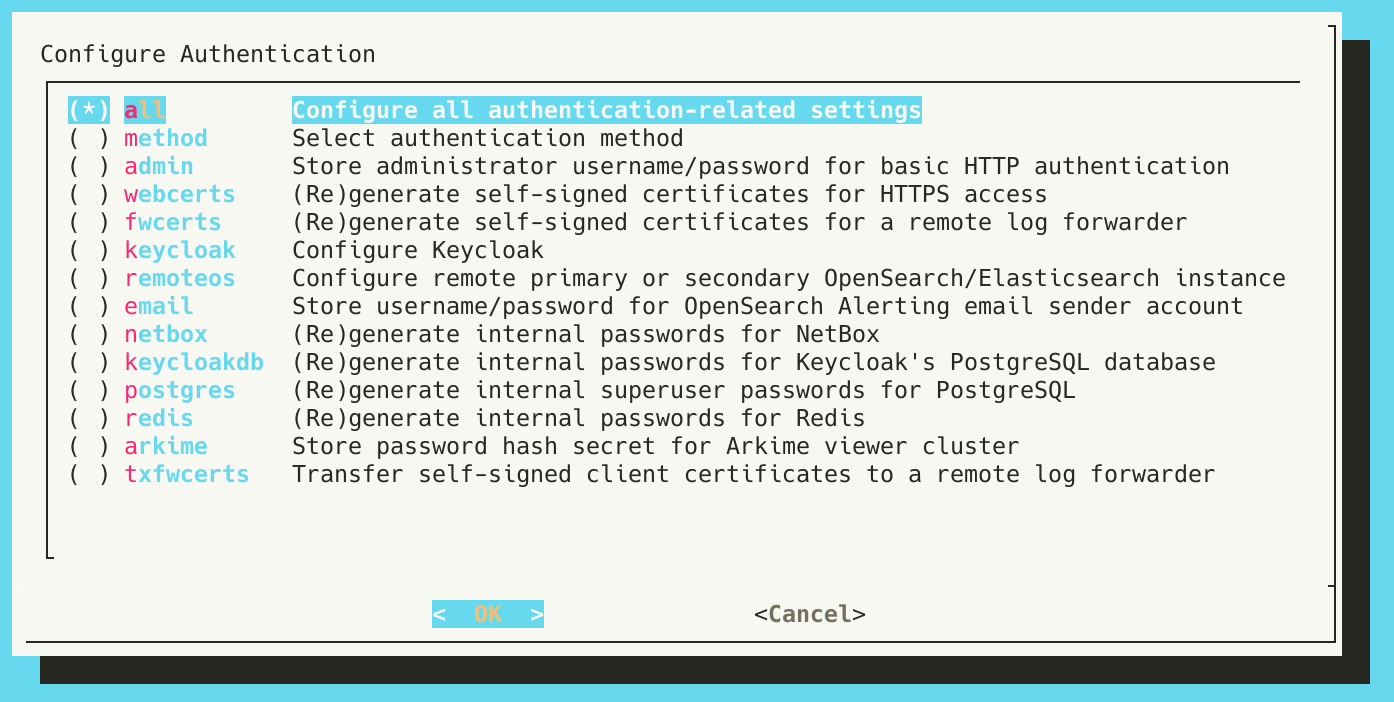
The Configure Authentication dialog
As this is the first time setting up authentication, ensure the all option is selected and press OK.
Users will be prompted to do the following:
- Select authentication method
- Choose basic, to use TLS-encrypted HTTP basic authentication (default); ldap Lightweight Directory Access Protocol (LDAP) authentication; keycloak to use authentication managed by Malcolm’s embedded Keycloak instance; keycloak_remote to use authentication managed by a remote Keycloak instance; or, no_authentication to disable authentication (not recommended)
- Select LDAP server compatibility type
- This question allows users to specify Microsoft Active Directory compatibility (winldap) or generic LDAP compatibility (openldap, for OpenLDAP, glauth, etc.) when using LDAP authentication
- Use StartTLS (rather than LDAPS) for LDAP connection security?
- When using LDAP authentication, this question allows users to configure LDAP connection security
- Store administrator username/password for local Malcolm access
- This allows the user to specify the administrator credentials when using local account management (instead of LDAP) for authentication.
- (Re)generate self-signed certificates for HTTPS access
- This generates the self-signed TLS certificates used for encrypting the connections between users’ web browsers and Malcolm.
- (Re)generate self-signed certificates for a remote log forwarder
- This generates the self-signed TLS certificates for communications from a remote log forwarder (such as Hedgehog Linux or forwarders for other third-party logs).
- Configure Keycloak
- Users may answer Y to configure Keycloak as Malcolm’s provider of user authentication. See Configure authentication: Keycloak for more information.
- Configure Role-Based Access Control
- If using Keycloak, users may enable role-based access control. See Role-based access control for more information.
- Store username/password for OpenSearch/Elasticsearch instance
- Users should answer N if using Malcolm’s local OpenSearch instance, or Y to specify credentials for a remote OpenSearch or Elasticsearch cluster (see OpenSearch and Elasticsearch instances).
- Store username/password for OpenSearch Alerting email sender account
- Users may answer Y to specify credentials for Email Sender Accounts to be used with OpenSearch Dashboards’ alerting plugin.
- (Re)generate internal passwords for NetBox
- If users answered Y to “Should Malcolm run and maintain an instance of NetBox…?” during the configuration questions, they should also answer Y to this question the first time authentication is configured. Note that once NetBox data has been populated, regenerating these passwords will make it impossible for Malcolm to access that existing data. For this reason, subsequent operations to generate these passwords will warn the user: “Internal passwords for NetBox already exist. Overwriting them will break access to a populated NetBox database. Are you sure?” Users should use make a backup of NetBox data before regenerating these passwords.
- (Re)generate internal superuser passwords for PostgreSQL
- Malcolm uses PostgreSQL to store the configuration and state of several components, including NetBox. Users should answer Y to this question the first time authentication is configured. The same warning described for the previous question applies here: users should not regenerate the internal superuser passwords for PostgreSQL without first backing up their existing NetBox configuration to restore again afterwards.
- (Re)generate internal passwords for Valkey
- Malcolm uses Valkey to store session information for several components, including NetBox. Users should answer Y to this question the first time authentication is configured.
- Store password hash secret for Arkime viewer cluster
- This value corresponds to the
passwordSecretvalue in Arkime’s config.ini file. Arkime uses this value to secure communication (specifically, the connection used when Arkime viewer retrieves a PCAP payload for display in its user interface) between Arkime viewers in instances of Malcolm and Hedgehog Linux. In other words, this value needs to be the same for the Malcolm instance and all of the instances of Hedgehog Linux forwarding Arkime sessions to that Malcolm instance. The corresponding value should be provided when runningauth_setupon the Hedgehog Linux sensor.
- This value corresponds to the
- Transfer self-signed client certificates to a remote log forwarder
- In order for a sensor running Hedgehog Linux to securely communicate with Malcolm, it needs a copy of the client certificates generated when “(Re)generate self-signed certificates for a remote log forwarder” was selected earlier. Malcolm can facilitate the secure transfer of these certificates. If users will be continuing on to configure a sensor running Hedgehog Linux, they should answer Y here. They will be prompted to “Run auth_setup on the sensor and select ‘Receive client certificates from Malcolm’”. Users should continue on with the instructions for Hedgehog Linux Installation and Configuration, then return here and press Enter once they have chosen the corresponding
auth_setupoperation below. After that process is complete, users may press OK and Malcolm will continue to start up. 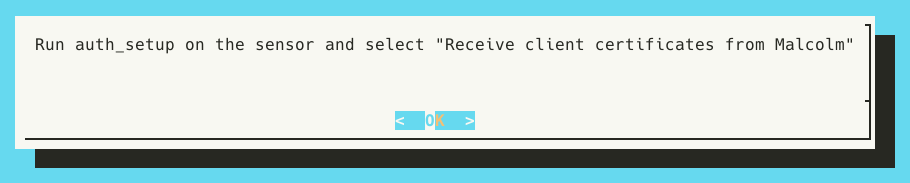
- In order for a sensor running Hedgehog Linux to securely communicate with Malcolm, it needs a copy of the client certificates generated when “(Re)generate self-signed certificates for a remote log forwarder” was selected earlier. Malcolm can facilitate the secure transfer of these certificates. If users will be continuing on to configure a sensor running Hedgehog Linux, they should answer Y here. They will be prompted to “Run auth_setup on the sensor and select ‘Receive client certificates from Malcolm’”. Users should continue on with the instructions for Hedgehog Linux Installation and Configuration, then return here and press Enter once they have chosen the corresponding
Hedgehog Linux Installation and Configuration
As of Malcolm v25.12.0, the same base operating system is used for both Malcolm and Hedgehog Linux. All of the sections above under Malcolm Installation and Configuration also apply to Hedgehog Linux.
The following section outlines the Hedgehog-specific steps needed to establish communication between the Hedgehog Linux sensor and the Malcolm aggregator. See Configuring Hedgehog for Standalone Use for how to use Hedgehog Linux without a Malcolm aggregator.
Configuring Communication Between Hedgehog and Malcolm
Follow the Malcolm guidelines above for Configuring Network Interfaces and Configuring Hostname, Time Sync, and SSH Access.
The first time Hedgehog Linux boots the Malcolm Configuration wizard will start automatically. This same configuration script can be run again later by running ./scripts/configure from the Malcolm installation directory, or clicking the Configure Malcolm 🔳 icon in the top panel.
The sections above for Configuring Malcolm and the Malcolm Configuration Menu Items are applicable for Hedgehog Linux, with the following notable exceptions:
- Several configuration items deal with how Hedgehog Linux components communicate with the remote Malcolm aggregator:
- Primary Document Store
- The document store type (either
opensearch-remoteorelasticsearch-remote) of the Malcolm aggregator
- The document store type (either
- Remote Malcolm Hostname or IP
- Specifying the IP address or hostname of the Malcolm aggregator here will automatically populate the following items (or, they can be set or overridden individually):
- Primary OpenSearch/Elasticsearch URL
- The URL of the remote OpenSearch/Elasticsearch instance to be used as the data store (e.g.,
https://malcolm.example.org:9200orhttps://service.whatever.org/elasticsearch/)
- The URL of the remote OpenSearch/Elasticsearch instance to be used as the data store (e.g.,
- Logstash Host
- The IP address or hostname of the Malcolm aggregator, a colon (
:), and the Logstash port (5044). If the sensor is capturing locally but not forwarding to a Malcolm aggregator, explicitly set this todisabled.
- The IP address or hostname of the Malcolm aggregator, a colon (
- Arkime WISE URL
- The URL for the Malcolm aggregator’s Arkime WISE service. If the sensor is capturing locally but not forwarding to a Malcolm aggregator, explicitly set this to
disabled.
- The URL for the Malcolm aggregator’s Arkime WISE service. If the sensor is capturing locally but not forwarding to a Malcolm aggregator, explicitly set this to
- Malcolm Reachback ACL
- A list of IP addresses used to populate a firewall access control list (ACL) for hosts allowed to connect back to the sensor for retrieving session payloads from its PCAP files (over port
8005/tcp) for display in Arkime viewer and for downloading files (over port8006/tcp) extracted and preserved by Zeek. Minimally, this list should include the IP address of the Malcolm aggregator. This is only automatically populated from Remote Malcolm Hostname or IP if its value is an IP address.
- A list of IP addresses used to populate a firewall access control list (ACL) for hosts allowed to connect back to the sensor for retrieving session payloads from its PCAP files (over port
- Primary OpenSearch/Elasticsearch URL
- Specifying the IP address or hostname of the Malcolm aggregator here will automatically populate the following items (or, they can be set or overridden individually):
- NetBox Site Name
- This site name will be associated with the traffic captured on this sensor and used for NetBox enrichment lookups performed by the Malcolm aggregator.
- Primary Document Store
- Some examples of these values:
--- Malcolm Configuration Menu ---
…
│   ├── 18. Logstash Host (current: malcolm.home.arpa:5044)
│   ├── 19. Malcolm Reachback ACL (current: ['192.168.122.1', '192.168.122.5', '10.0.0.130'])
│   └── 20. Primary Document Store (current: opensearch-remote)
│       ├── 21. Primary OpenSearch/Elasticsearch URL (current: https://malcolm.home.arpa:9200)
…
├── 30. Enable Arkime Analysis (current: Yes)
│   └── 31. Arkime WISE URL (current: https://malcolm.home.arpa/wise/)
…
├── 55. NetBox Mode (current: Remote)
│   └── 56. NetBox Site Name (current: Remote Site ABC)
…
- Hedgehog Linux uses Fluent Bit to gather miscellaneous system resource metrics (CPU, network I/O, disk I/O, memory utilization, temperature, etc.) and the Beats protocol to forward these metrics to a Malcolm aggregator’s Logstash service for further enrichment prior to insertion into its OpenSearch database. Metrics categories can be enabled/disabled with the Forward … options under the Run Profile section:
--- Malcolm Configuration Menu ---
…
├── 6. Run Profile (current: hedgehog)
…
│   ├── 8. Forward AIDE Results (current: Yes)
│   ├── 9. Forward Audit Log (current: Yes)
│   ├── 10. Forward CPU Utilization (current: Yes)
│   ├── 11. Forward Disk Operation Statistics (current: Yes)
│   ├── 12. Forward Disk Utilization (current: Yes)
│   ├── 13. Forward Kernel Messages (current: Yes)
│   ├── 14. Forward Memory Utilization (current: Yes)
│   ├── 15. Forward Network Activity (current: Yes)
│   ├── 16. Forward Systemd Journal Logs (current: Yes)
│   ├── 17. Forward Thermal Readings (current: Yes)
…
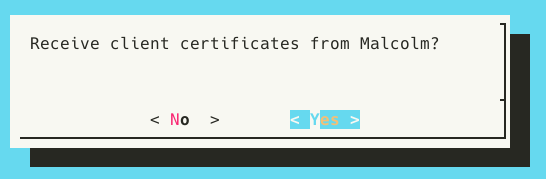
The auth_setup script on Hedgehog Linux has a Receive client certificates from Malcolm option corresponding to Malcolm’s Transfer self-signed client certificates to a remote log forwarder option described above. In order for a Hedgehog Linux to securely communicate with Malcolm, it needs the client certificates generated when users answered Y to (Re)generate self-signed certificates for a remote log forwarder during that setup. Malcolm can facilitate the secure transfer of these to a sensor running Hedgehog.
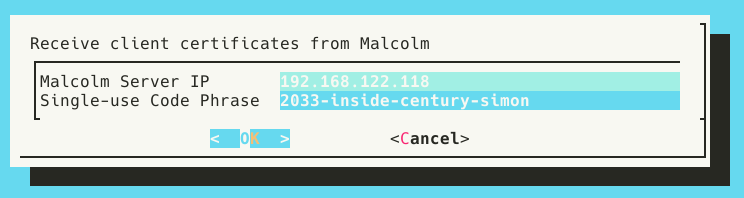
Select Receive client certificates from Malcolm, then press OK when prompted “Run auth_setup on Malcolm and select ‘Transfer self-signed client certificates…’”.
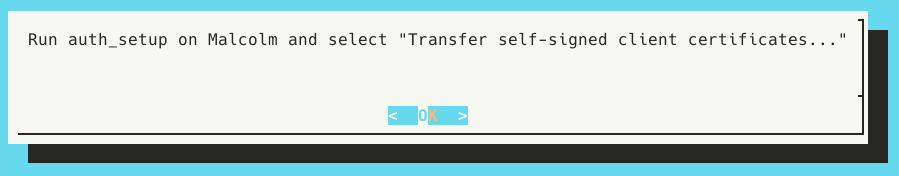
Return to the Malcolm instance where auth_setup is running (or re-run it if needed) and press OK. Users will see a message with the title ssl-client-transmit that looks like this:
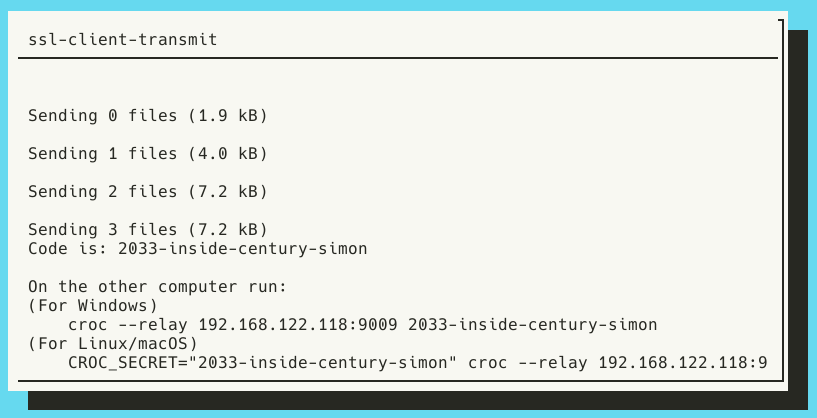
Note Malcolm’s IP address (192.168.122.5 in the screenshot above) and the single-use code phrase (2033-inside-century-simon in the screenshot above) and enter them on the Hedgehog:
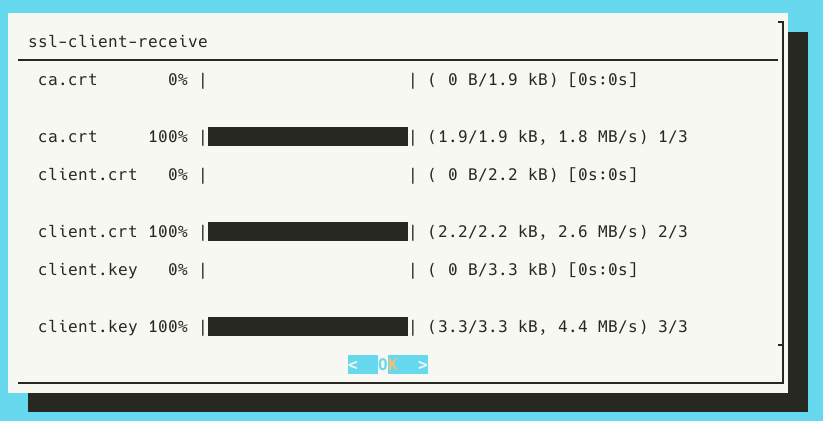
After a few seconds a progress bar will update and show the files have been 100% transferred. They are automatically saved into the ~/Malcolm/filebeat/certs directory on the sensor.
Once completed, users can click the “play” icon (▷) in the panel at the top of the desktop to start Malcolm under the Hedgehog run profile.
TCP Ports Required for Malcolm ↔ Hedgehog Communication
The following TCP ports on the Malcolm instance must be reachable for the sensor to forward data to Malcolm:
| Port | Data | Purpose |
|---|---|---|
| 443/tcp | Enrichment lookups for Arkime sessions | Hedgehog’s Arkime capture contacts Malcolm’s Arkime WISE at https://﹤Malcolm host or IP address﹥/wise, if enabled. |
| 9200/tcp | Arkime sessions | Hedgehog’s Arkime capture sends session data to Malcolm’s OpenSearch instance at https://﹤Malcolm host or IP address﹥:9200. Alternatively, 443/tcp may be used at https://﹤Malcolm host or IP address﹥/mapi/opensearch/. |
| 5044/tcp | Zeek logs, Suricata alerts, and file-scanning results | Hedgehog’s Filebeat sends data to Malcolm’s Logstash. |
| 5045/tcp | Auxiliary data (resources, temperature, system logs, etc.) | Hedgehog’s Fluent Bit sends data to Malcolm’s JSON-over-TCP listener. |
The following TCP ports on the Hedgehog sensor must be reachable for Malcolm to retrieve artifacts:
| Port | Data | Purpose |
|---|---|---|
| 8005/tcp | PCAP payload requests | Malcolm’s Arkime viewer contacts Hedgehog’s Arkime viewer when a user views an Arkime session, exports a PCAP, or runs a Hunt job |
| 8006/tcp | Extracted file requests | Malcolm proxies requests to download extracted files stored on the Hedgehog sensor. |
Verifying Traffic Capture and Forwarding
The easiest way to verify network traffic is being captured by the sensor and forwarded to Malcolm is through Malcolm’s Arkime Sessions interface.
If logged into the Malcolm desktop environment, click the Arkime icon (🦉) in the top panel. If connecting from another browser, connect to **https://
As Malcolm is using self-signed TLS certificates, users will likely have to confirm a browser exception to allow the self-signed certificates to proceed. Enter the credentials specified during the configure authentication process.
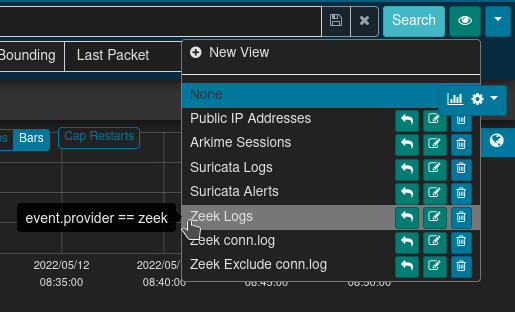
Arkime’s sessions view will be displayed. Filter on the node field to view records from a specific Hedgehog Linux sensor. In the search bar, enter node == hedgehoghostname (replacing hedgehoghostname with the hostname configured for Hedgehog Linux). See the Search Queries in Arkime and OpenSearch cheat sheet for more search syntax hints.
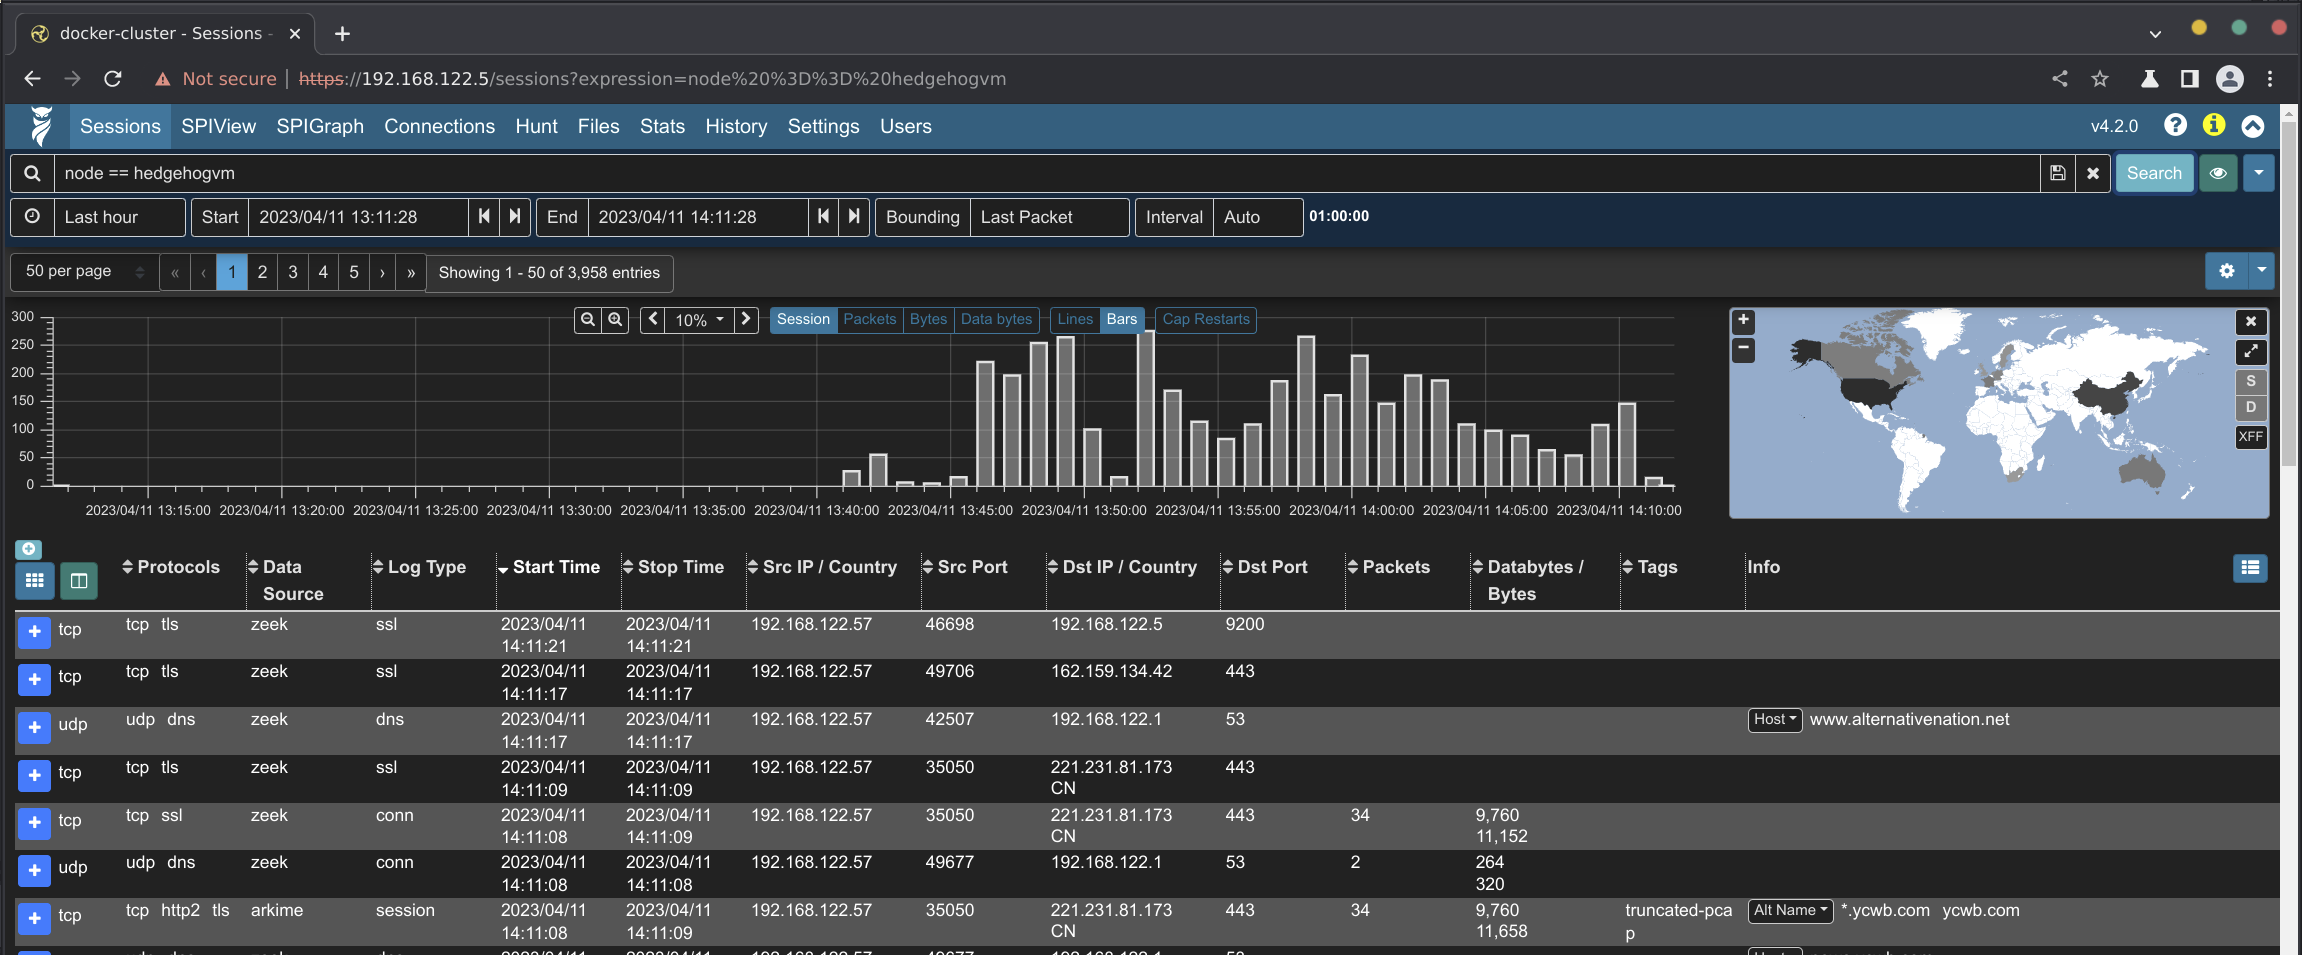
Arkime’s sessions view with a filter on node
Arkime’s views button (indicated by the eyeball 👁 icon) allows overlaying additional previously-specified filters onto the current sessions filters. For convenience, Malcolm provides several Arkime preconfigured views including filtering on the event.provider and event.dataset fields. This can be combined with the node filter described above to verify different network log types (e.g., Arkime sessions, Zeek logs, Suricata alerts, etc.) are all being captured and forwarded correctly.